Welcome back to KQL Toolbox 👋
In the last KQL Toolbox, we zoomed out and looked at billable ingest trends over time—how many GiB per day you’re ingesting, and roughly how much that’s costing you in Microsoft Sentinel. This time, we’re zooming in.
Because once you can say “We’re ingesting 150 GiB/day and spending ~$645/day”, the very next question from your boss, your CFO, or your own anxiety is:
“Okay… which log sources are burning that money?”
That’s what today’s query set is all about: Top 10 log sources by cost, and then drilling into two usual suspects:
CommonSecurityLog(firewalls, proxies, etc.)SecurityEvent(Windows security logs)
We’ll walk through three variations of the same pattern:
- Top 10 Log Sources by Cost (All Tables)
- Top 10
CommonSecurityLogSeverity Levels by Cost - Top 10
SecurityEventEvent IDs by Cost
All three use the same idea: Sum the billable bytes → convert to GiB → multiply by your per-GB price → rank by cost.
Get the full, copy-pasta ready KQL queries here on GitHub:
- 🔗 Top 10 Log Sources with Cost (Enhanced)
- 🔗 Top 10 CommonSecurityLogs by Severity Level with Cost (Enhanced)
- 🔗 Top 10 Security Events with Cost (Enhanced)
Quick Primer: _IsBillable and _BilledSize
Every Log Analytics table (including Usage, CommonSecurityLog, SecurityEvent, etc.) comes with two core columns for cost analysis:
_IsBillable–trueif this record actually counts toward your bill._BilledSize– size of the record in bytes that you’re billed for.
These are your per-row cost knobs. Instead of just counting events, you can say: “Which events and patterns are responsible for the largest share of my ingestion bill❓”
Query 1 – Top 10 Log Sources by Cost (All Tables)
First, let’s answer the high-level question: “Which tables (log sources) are costing us the most over the last 30 days❔”
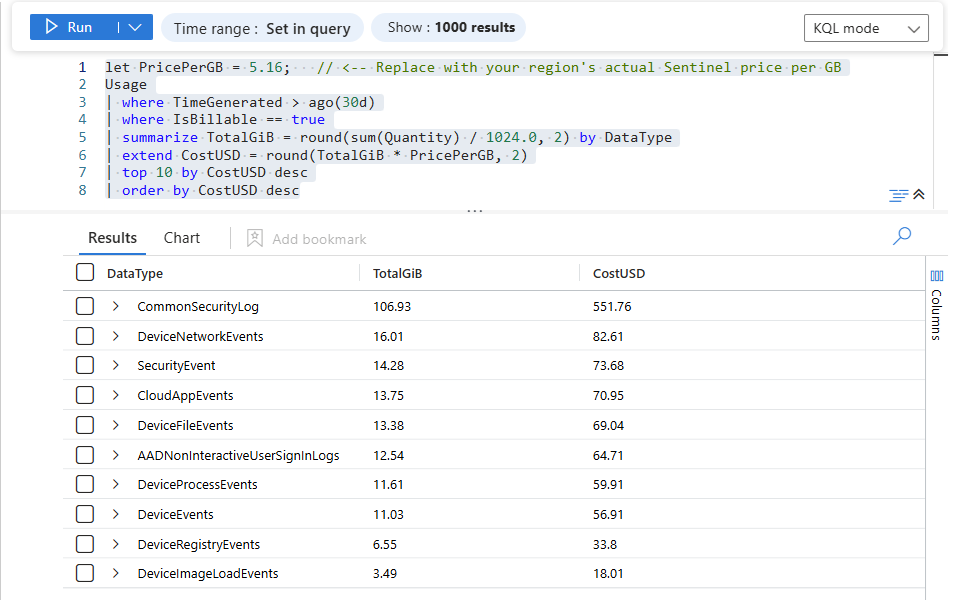
// KQL Toolbox #2 - Query 1
// Top 10 log sources (tables) by total cost

let PricePerGB = 5.16;   // <-- Replace with your region's actual Sentinel price per GB

Usage
| where TimeGenerated > ago(30d)
| where IsBillable == true
| summarize TotalGiB = round(sum(Quantity) / 1024.0, 2) by DataType
| extend CostUSD = round(TotalGiB * PricePerGB, 2)
| top 10 by CostUSD desc
| order by CostUSD desc
What this does, line-by-line…
-
let PricePerGB = 4.30;- Workspace-specific knob for your per-GB Sentinel ingest cost.
- Replace
4.30with your region’s actual value from the official Microsoft Sentinel pricing page.
-
Usage- The ingest ledger table—one row per meter usage entry.
- This is what we used heavily in KQL Toolbox #1 for trend analysis.
-
| where TimeGenerated > ago(30d)- Scope to the last 30 days for a nice “recent” view.
- Swap
30dfor7d,90d, or whatever cadence fits your QBRs.
-
| where IsBillable == true- We only care about log sources that actually cost money. (Some tables can be free/benefit-covered.)
-
| summarize TotalGiB = round(sum(Quantity) / 1024.0, 2) by DataTypeQuantityis in MB; divide by1024to get GiB. ([Azure Docs][3])round(..., 2)keeps results human-friendly (e.g.,152.37GiB).- Group by
DataType= table name (SecurityEvent,CommonSecurityLog,SigninLogs, etc.).
-
| extend CostUSD = round(TotalGiB * PricePerGB, 2)- Convert GiB → dollars with a single inline expression.
- This is your “ingest bill by table.”
-
| top 10 by CostUSD desc- Surface just your top 10 most expensive log sources.
This immediately tells you:
- Are firewall logs the main culprit? (
CommonSecurityLog) - Are Windows Security logs (
SecurityEvent) eating the bulk of your budget? - Are there any surprises—like
Syslog,AuditLogs, or some obscure connector suddenly popping at the top?
Once you know which table is noisy, the next step is to dig inside that table.
⚔️ Steps to Operationalize:
- Schedule this query to run weekly via a Sentinel scheduled analytics rule or runbook.
- Visualize on a dashboard showing cost contribution by log source.
- Monthly review in SOC/QBR meetings to identify cost outliers.
🚨 Example Alerting:
- Threshold alert when any log source exceeds a configured GiB/day or cost/day threshold, triggering an investigation into noisy sources.
🛡️ Framework Mapping:
-
NIST CSF DE.CM-7 – Monitors and analyzes continuous events for potential malicious activity or misconfigurations; here it adds a cost lens to visibility.
-
NIST CSF ID.RA-1 – Helps classify the sources of logs (assets/systems) and determine their impact.
-
CIS Control 6 (Maintenance, Monitoring, and Analysis of Audit Logs) – Ensures audit logs are collected and analyzed for usability and cost effectiveness.
Query 2 – Top 10 CommonSecurityLog Severity Levels by Cost
In many environments, CEF-based logs (firewalls, proxies, VPNs) are some of the biggest cost drivers. Those land in CommonSecurityLog.
But not all firewall events are equal:
- Some are high-value (blocks, VPN auths, IDS/IPS alerts).
- Some are boring noise (session teardown, heartbeats, low-value allow events).
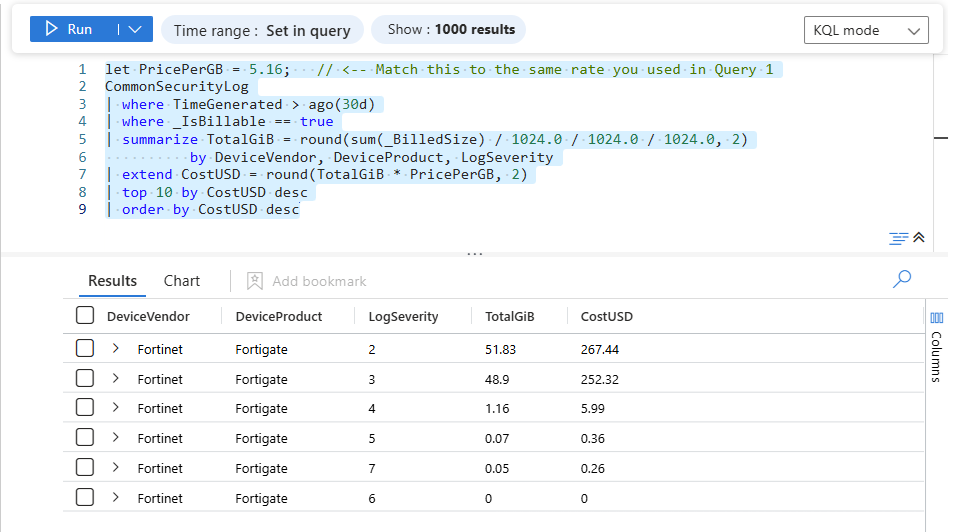
This query uses _IsBillable and _BilledSize directly on the table to show which severity levels (and products) within CommonSecurityLog are costing you the most.
// KQL Toolbox #2 - Query 2
// Top 10 CommonSecurityLog severity levels by cost

let PricePerGB = 5.16;   // <-- Match this to the same rate you used in Query 1

CommonSecurityLog
| where TimeGenerated > ago(30d)
| where _IsBillable == true
| summarize TotalGiB = round(sum(_BilledSize) / 1024.0 / 1024.0 / 1024.0, 2)
          by DeviceVendor, DeviceProduct, LogSeverity
| extend CostUSD = round(TotalGiB * PricePerGB, 2)
| top 10 by CostUSD desc
| order by CostUSD desc
How this works:
-
CommonSecurityLog- The “CEF catch-all” table for supported security appliances—firewalls, proxies, etc.
-
| where _IsBillable == true- Same idea as before, but now the billing flag is on the table itself. ([Azure Docs][3])
-
sum(_BilledSize)_BilledSizeis per-row billed bytes. Summed, it gives you the exact ingest volume for this group.
-
/ 1024 / 1024 / 1024-
Convert bytes → GiB:
/ 1024= KiB/ 1024= MiB/ 1024= GiB
-
-
Group by
DeviceVendor,DeviceProduct,LogSeverityDeviceVendor– e.g., Palo Alto Networks, Fortinet, Check PointDeviceProduct– specific product lineLogSeverity– CEF severity (e.g., Informational, Low, Medium, High, Critical)
This gives you a neat table like:
| DeviceVendor | DeviceProduct | LogSeverity | TotalGiB | CostUSD |
|---|---|---|---|---|
| Palo Alto | PAN-OS | Informational | 220.48 | 948.06 |
| Palo Alto | PAN-OS | Low | 145.12 | 623.02 |
| Fortinet | FortiGate | Informational | 89.33 | 383.12 |
| … | … | … | … | … |
From there you can ask:
- “Why are Informational events costing us more than all our High / Critical combined?”
- “Are we over-logging low-value categories on the firewalls?”
- “Can we use DCRs or transformation rules to drop/trim noisy patterns before ingest?”
This is where real savings happen: You’re not randomly turning off logs—you’re specifically targeting the lowest-value, highest-cost severities.
⚔️ Steps to Operationalize:
- Embed in a workbook segmented by vendor/product and severity.
- Pair with DCR/Log Filters: Identify low-value severity buckets (e.g., informational or low) that can be filtered or redirected to Basic tier or external storage.
- Integrate with Change Controls: When tuning log sources, include cost impact in the change request narrative.
🚨 Example Alerting:
- Alert when a new vendor or severity group suddenly rises above expected cost baselines.
🛡️ Framework Mapping:
-
NIST CSF DE.CM-8 – Use automated tools to support detection processes; here it adds depth to severity interpretation.
-
NIST CSF PR.IP-1 – Baselines for configuration and cost awareness.
-
CIS Control 6.1 & 6.2 – Ensure audit logs and network device logs are collected and analyzed (including cost efficiency).

Query 3 – Top 10 SecurityEvent Event IDs by Cost
Now let’s turn that same idea on another noisy classic:
Windows Security logs (
SecurityEvent).
We’ll use _IsBillable and _BilledSize again to find which Event IDs are contributing the most to cost.
// KQL Toolbox #2 - Query 3
// Top 10 SecurityEvent Event IDs by cost

let PricePerGB = 5.16;   // <-- Same price knob as before

SecurityEvent
| where TimeGenerated > ago(30d)
| where _IsBillable == true
| summarize TotalGiB = round(sum(_BilledSize) / 1024.0 / 1024.0 / 1024.0, 2)
          by EventID, Activity
| extend CostUSD = round(TotalGiB * PricePerGB, 2)
| top 10 by CostUSD desc
| order by CostUSD desc

Why this is powerful
-
Cost by Event ID
-
Instead of “Windows logs are expensive,” you can now say:
- “EventID 5156 (Windows Filtering Platform) is costing us $X/month.”
- “EventID 4624 (successful logon) vs. 4625 (failed logon) cost comparison.”
-
-
Activity- Including
Activityin the grouping gives a human-readable description next to the ID ("An account was successfully logged on", etc.).
- Including
This helps you decide:
- Which Event IDs are high-noise, low-value for your use cases.
- Where you can potentially filter or redirect to a cheaper tier (Basic, Auxiliary, or external storage) instead of the full Analytics tier.
When you combine this with detections you actually care about, you can be ruthless:
“These 3 Event IDs matter for our threat models. The other 12 are tax.”
⚔️ Steps to Operationalize:
- Include in monthly cost review alongside threat detection priorities.
- Map high-cost Event IDs to detection rules to ensure you aren’t dropping signals needed for security detections if tuning filters.
- Run histograms/heatmaps to visualize shifts over time in noisy WindowsIDs.
🚨 Example Alerting:
- Alert when a specific Event ID’s cost contribution increases above established percent of total.
🛡️ Framework Mapping:
- NIST CSF DE.DP-4 (Event detection) – Identifies anomalous activities via event patterns; here with cost relevance.
- NIST CSF PR.IP-3 – Secure configurations informed by usage and impact.
- CIS Control 8 (Audit Log Management) – Ensures audit event logs are used effectively for both security and cost governance.
👀 Visual Upgrade!
Did you know you can use Emojies in your KQL!?
Let’s add some severity colour-coding to make our query results pop!
Query 1 - Revamped!
Usage
| where TimeGenerated > ago(30d)
| where IsBillable == true
| summarize GiB= round(sum(Quantity) / 1024, 2) by DataType
| extend Cost=round(GiB * 5.16, 2)
| sort by Cost desc
| extend CostLevel = case(
                         Cost >= 1000,
                         '🤑🤑🤑🤑🤑',  // Most Expensive
                         Cost >= 750,
                         '💰💰💰💰',
                         Cost >= 500,
                         '💰💰💰',
                         Cost >= 250,
                         '💰💰',
                         Cost >= 100,
                         '💰',          // Least Expensive
                         '💸'                         // Fallback
                     )
| extend Cost=strcat('$', Cost, ' ', CostLevel)
| project DataType, GiB, Cost
| take 10

This is purely presentation/triage. It buckets spend into ranges for quick scanning, but it looks cool!
💡 Pro Tip: The order of case() matters:
👉 it checks top-to-bottom and stops at the first match (so the >= 1000 check must come before >= 100, etc.).
Query 2 - Revamped!
CommonSecurityLog
| where TimeGenerated > ago(90d)
| where isnotempty(Reason) and Reason != "N/A"
| summarize TotalEvents = count(),
            TotalBytes = sum(_BilledSize)
            by Reason, LogSeverity
| extend TotalGB = round(TotalBytes / (1024.0 * 1024.0 * 1024.0), 4)
| extend RawCost = round(TotalGB * 5.16, 2)
| extend CostLevel = case(
                         RawCost >= 1000, '🤑🤑🤑🤑🤑',
                         RawCost >= 750, '💰💰💰💰',
                         RawCost >= 500, '💰💰💰',
                         RawCost >= 250, '💰💰',
                         RawCost >= 100, '💰',
                         '💸')
| extend IngestCost = strcat('$', tostring(RawCost), ' ', CostLevel)
| project Reason, LogSeverity, TotalEvents, TotalGB, IngestCost
| top 10 by TotalEvents desc

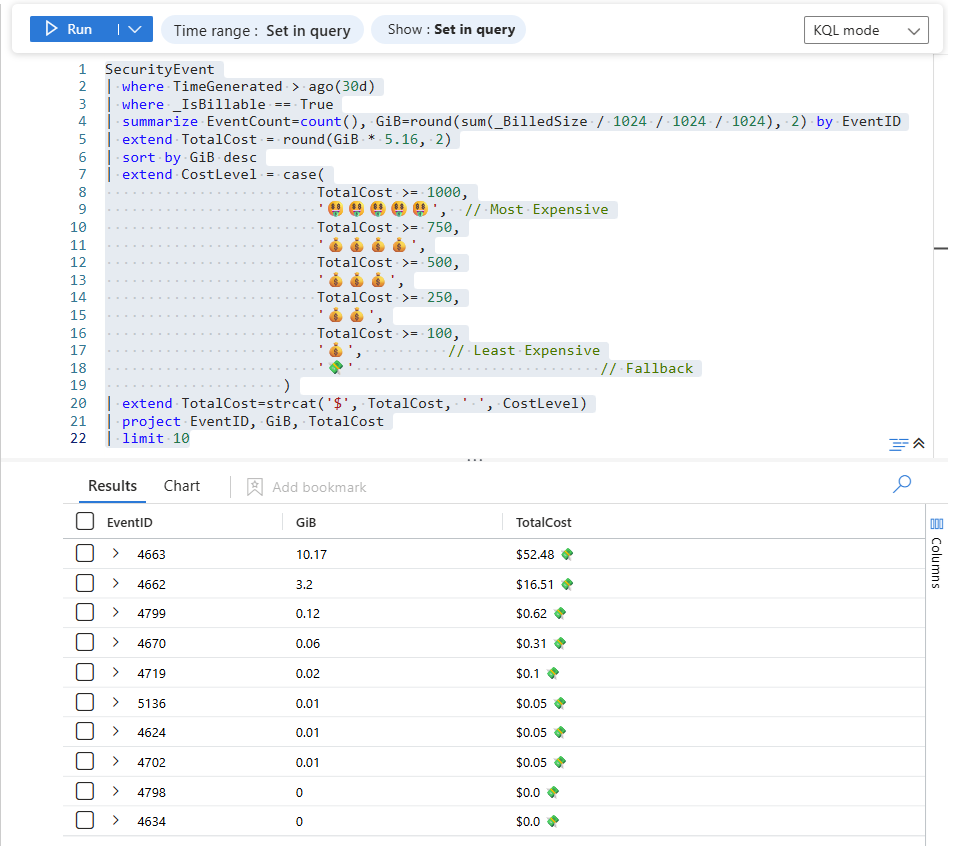
Query 3 - Revamped!
SecurityEvent
| where TimeGenerated > ago(30d)
| where _IsBillable == True
| summarize EventCount=count(), GiB=round(sum(_BilledSize / 1024 / 1024 / 1024), 2) by EventID
| extend TotalCost = round(GiB * 5.16, 2)
| sort by GiB desc
| extend CostLevel = case(
                         TotalCost >= 1000,
                         '🤑🤑🤑🤑🤑',  // Most Expensive
                         TotalCost >= 750,
                         '💰💰💰💰',
                         TotalCost >= 500,
                         '💰💰💰',
                         TotalCost >= 250,
                         '💰💰',
                         TotalCost >= 100,
                         '💰',          // Least Expensive
                         '💸'                             // Fallback
                     )
| extend TotalCost=strcat('$', TotalCost, ' ', CostLevel)
| project EventID, GiB, TotalCost
| limit 10
Putting It All Together: A Simple Cost-Hunting Workflow
Here’s how I use these three queries in the real world:
-
Start with KQL Toolbox #1, query #1:
- Spot trends and spikes in overall billable ingest.
-
Run Query 1 (Top 10 log sources by cost):
- Identify which tables are the heaviest hitters.
-
For
CommonSecurityLog:- Run Query 2 to see which vendor/product + severity combos are burning the most.
- Tune firewalls / proxies / DCRs accordingly.
-
For
SecurityEvent:- Run Query 3 to see which Event IDs are your biggest cost drivers.
- Review which ones actually matter to your detections and compliance requirements.
-
Turn insights into actions:
- Data Collection Rules (DCRs) to filter or transform
- Move low-value logs to Basic/Auxiliary tiers or an external data lake
- Adjust retention on particularly noisy tables
Run this loop once a month (or per QBR), and you’ll steadily chip away at:
- Unnecessary ingest
- Unnecessary spend
- While keeping the signal you actually need for detection and forensics.
Operationalizing these & Mapping to NIST/CIS Outcomes
The three core queries in this post help you pinpoint which log sources (tables, severities, or event IDs) are driving the majority of your Microsoft Sentinel ingestion costs. To make these queries truly operational — that is, actionable, repeatable, and tied to security outcomes — you should embed them into recurring monitoring workflows, alerts, dashboards, and governance processes. Below is a breakdown of how to do that in context of NIST CSF and CIS Controls.
Operational Playbook Patterns
Here’s a pattern you can embed into your daily/weekly SOC processes:
1) Scheduled Monitoring & Alerts
- Run the Top 10 Tables by Cost query every Monday.
- Generate alerts if any log source cost increases by x% vs prior week.
- Outcome: Continuous detection of ingest anomalies and cost spikes.
2) Dashboards with Context
- Build a Cost + Value Dashboard that shows:
- Total cost by log source
- Percentage of total
- Severity breakdown (for CEF logs)
- EventID relevance
- Outcome: Centralized monitoring that supports both security and governance decisions.
3) Governance Review Loop
- Monthly review of top cost drivers.
- Pair with detection and compliance policies to decide:
- If the log source is essential
- If filtering / transformations are required
- If retention tiers need adjustment
- Outcome: Improve log signal-to-noise ratio and align with organizational risk appetite.
Mapping to Compliance and Security Outcomes
| Query / Activity | NIST CSF Outcome | CIS Control Outcome |
|---|---|---|
| Top 10 log source cost (Query 1) | DE.CM-7 (Continuous monitoring) | 6.1-6.2 Audit log analysis |
| Severity cost breakdown (Query 2) | DE.CM-8 (Automated detection tools) | 6.2, 8 Log management |
| EventID cost ranking (Query 3) | DE.DP-4 (Event detection and analysis) | 8 Focused audit log analysis |
| Alert thresholds | DE.AE-5 (Response to events) | 6.6 Alert triage |
💡 These mappings justify why cost governance is part of detection engineering, not a finance-only exercise.
Quick Implementation Checklist
☑ Automate these queries as Sentinel scheduled analytics rules
☑ Dashboards visualizing cost drivers and trends
☑ Threshold Alerts for anomalous cost spikes
☑ DCR/Retention Plans tied to cost & value analysis
☑ Monthly Review Process with documented tuning decisions
⚠️ Caveats and Nuances to Keep in Mind
A few important notes before you start deploying chainsaws to your logs:
-
Cost math is workspace- and region-specific.
-
Always plug in your actual Sentinel price per GB from the official Microsoft pricing page, and not the example I’m using here.
-
-
_BilledSize and _IsBillable are the source of truth.
-
They account for compression and internal sizing—so they’ll differ from raw event sizes; Log standard columns – Microsoft Learn.
-
-
Don’t cut before checking detections.
-
Before trimming a noisy Event ID or severity, check:
- Do any existing analytics rules rely on it?
- Could future threat hunts need it?
- Are there any regulatory or forensic reasons to keep it?
-
-
Trend first, then optimize.
- That’s why KQL Toolbox #1 was all about trends; so KQL Toolbox 2 can transition into top talkers.
-
Use both to tell a complete story:
- “Here’s how our ingest/cost is trending.”
- “Here are the specific log sources and patterns we adjusted to control it.”
⏩ Next Steps
Here’s your homework for this week:
- Run Query 1 in your Sentinel workspace and export the results.
-
Circle the top 3 cost drivers and ask:
- “Are these logs worth what we’re paying for them?”
-
For at least one of those tables:
- If it’s
CommonSecurityLog, run Query 2. - If it’s
SecurityEvent, run Query 3. - Identify one concrete optimization (filter, transformation, tier change, or reduced retention).
- If it’s
-
Document the change + impact:
- “We trimmed X logs, saving ~Y GiB/day (~$Z/month).”
Run this exercise across a few months and you’ll not only cut costs, you’ll also build a defensible narrative for leadership:
👉 “We didn’t just reduce logging—we removed low-value noise while preserving (and sometimes improving) security signal.” 😎
🧠 Closing Thoughts
At this point, you’re no longer guessing where your Sentinel budget disappears — you’ve got hard evidence. You can see which tables are screaming, which severities are over-collecting, and which data sources are quietly siphoning dollars day after day. That visibility alone puts you ahead of most SOCs still flying blind.
But here’s the reality check: tables don’t create noise — specific events do. And events don’t log themselves.
In the next installment of KQL Toolbox, we zoom all the way in — down to the exact Event IDs, accounts, and systems responsible for the bloat. You’ll move from “this table is expensive” to “this event, on this host, by this user, is the problem.” 🔍🔥
That’s where cost optimization turns into control, and logging hygiene becomes an engineering discipline — not a guessing game.
Stay sharp. The receipts are about to get very specific. 😼⚔️
📚 Want to go deeper?
From logs and scripts to judgment and evidence — the DevSecOpsDad Toolbox shows how to operate Microsoft security platforms defensibly, not just effectively.
🛠️ KQL Toolbox: Turning Logs into Decisions in Microsoft Sentinel
🧰 PowerShell Toolbox: Hands-On Automation for Auditing and Defense
📖 Ultimate Microsoft XDR for Full Spectrum Cyber Defense
Real-world detections, Sentinel, Defender XDR, and Entra ID — end to end.
👉 Now go make those noisy logs pay rent. 😼🗡️💰
🔗 Helpful Links & Resources
- 🛠️ Kql Toolbox #1: Track & Price Your Microsoft Sentinel Ingest Costs
- ⚡ Top 10 Log Sources with Cost (Enhanced)
- ⚡ Top 10 CommonSecurityLogs by Severity Level with Cost (Enhanced)
- ⚡ Top 10 Security Events with Cost (Enhanced)
- 💲 Official Microsoft Sentinel pricing page
- 📚 Standard columns in Azure Monitor log records
- 📚 Plan costs and understand pricing and billing
- 📚 Analyze usage in Log Analytics workspace
- 📚 Azure Monitor Logs reference - CommonSecurityLog
- 📚 Azure Monitor Logs reference - SecurityEvent
- 📚 Reduce costs for Microsoft Sentinel
- 📚 Log standard columns – Microsoft Learn
- 📚 Analyze usage in Azure Monitor Logs – Microsoft Learn
- 📚 StorageBlobLogs table reference – Microsoft Learn
- 📚 DeviceInfo table reference – Microsoft Learn
- 😼 Legend of Defender Ninja Cat
Other Fun Stuff…
- 🧰 Powershell Toolbox Part 1 Of 4: Azure Network Audit
- 🧰 Powershell Toolbox Part 2 Of 4: Azure Rbac Privileged Roles Audit
- 🧰 Powershell Toolbox Part 3 Of 4: Gpo Html Export Script — Snapshot Every Group Policy Object In One Pass
- 🧰 Powershell Toolbox Part 4 Of 4: Audit Your Scripts With Invoke Scriptanalyzer
