Welcome back to KQL Toolbox 👋
Welcome back to the DevSecOpsDad KQL Toolbox series! In the last entry KQL Toolbox #2, we zoomed in on log source cost drivers—using _IsBillable and _BilledSize to identify which tables, severities, and Event IDs were burning the most money in Microsoft Sentinel.
👉 This week, we’re building directly on that foundation… Because once you know which log sources and which Event IDs are the most expensive, the very next question becomes:
“Okay… but which Event ID fires the most often, and which accounts are responsible for generating it?”
This is where today’s KQL shines 🌞
🛠️ KQL Toolbox #3: Which Event ID Noises Up Your Logs (and Who’s Causing It)?
Instead of looking at cost, we shift focus to raw event frequency—a metric that drives both noise and cost. With a small set of chained KQL queries, you’ll move from identifying noisy Event IDs to pinpointing the exact users and devices responsible — and finally alert only when behavior changes. Let’s identify:
- Which Event ID fires most in your environment over the last 30 days?
- Which accounts are generating that Event ID the most?
- Which devices are these Event ID’s coming from?
- Compare recent activity against a baseline.
This gives you a clean, fast workflow for spotting noisy Event IDs, isolating misconfigured or anomalous accounts, and tightening both your detection logic and cost posture. With that, let’s jump into this week’s analysis…
🔊 Today’s KQL helps you spot the loudest Event ID in your environment — and then drill down into which accounts are responsible for firing it most often.
These queries are perfect for your weekly cost-noise correlation checks, operational hygiene reviews, or threat hunting warmups.
💾 Full queries are in my public repo:
- 🔗 Which EventID fires the most in a month?
- 🔗 Which Accounts are throwing this EventID?
- 🔗 Which Devices are Throwing this EventID?
- 🔗 Which Event IDs Are Suddenly Acting Weird?
🔍 Why This Matters
Frequent aggregation and ranking of event volumes help you spot noise that obscures real threats. Comprehensive logging and centralized analysis — combined with targeted filtering like this — improves both cost efficiency and detection quality.
In most orgs, a handful of Event IDs generate most of the volume in SecurityEvent — and those high-frequency IDs can:
- Inflate your ingest costs
- Obscure real signals from the noise
- Make detection rules less efficient
- Hide suspicious behavior behind mountains of normal activity
So step one is simple: Find the Event ID that fires most often — then look at who’s actually triggering it… And that’s exactly what today’s queries do.
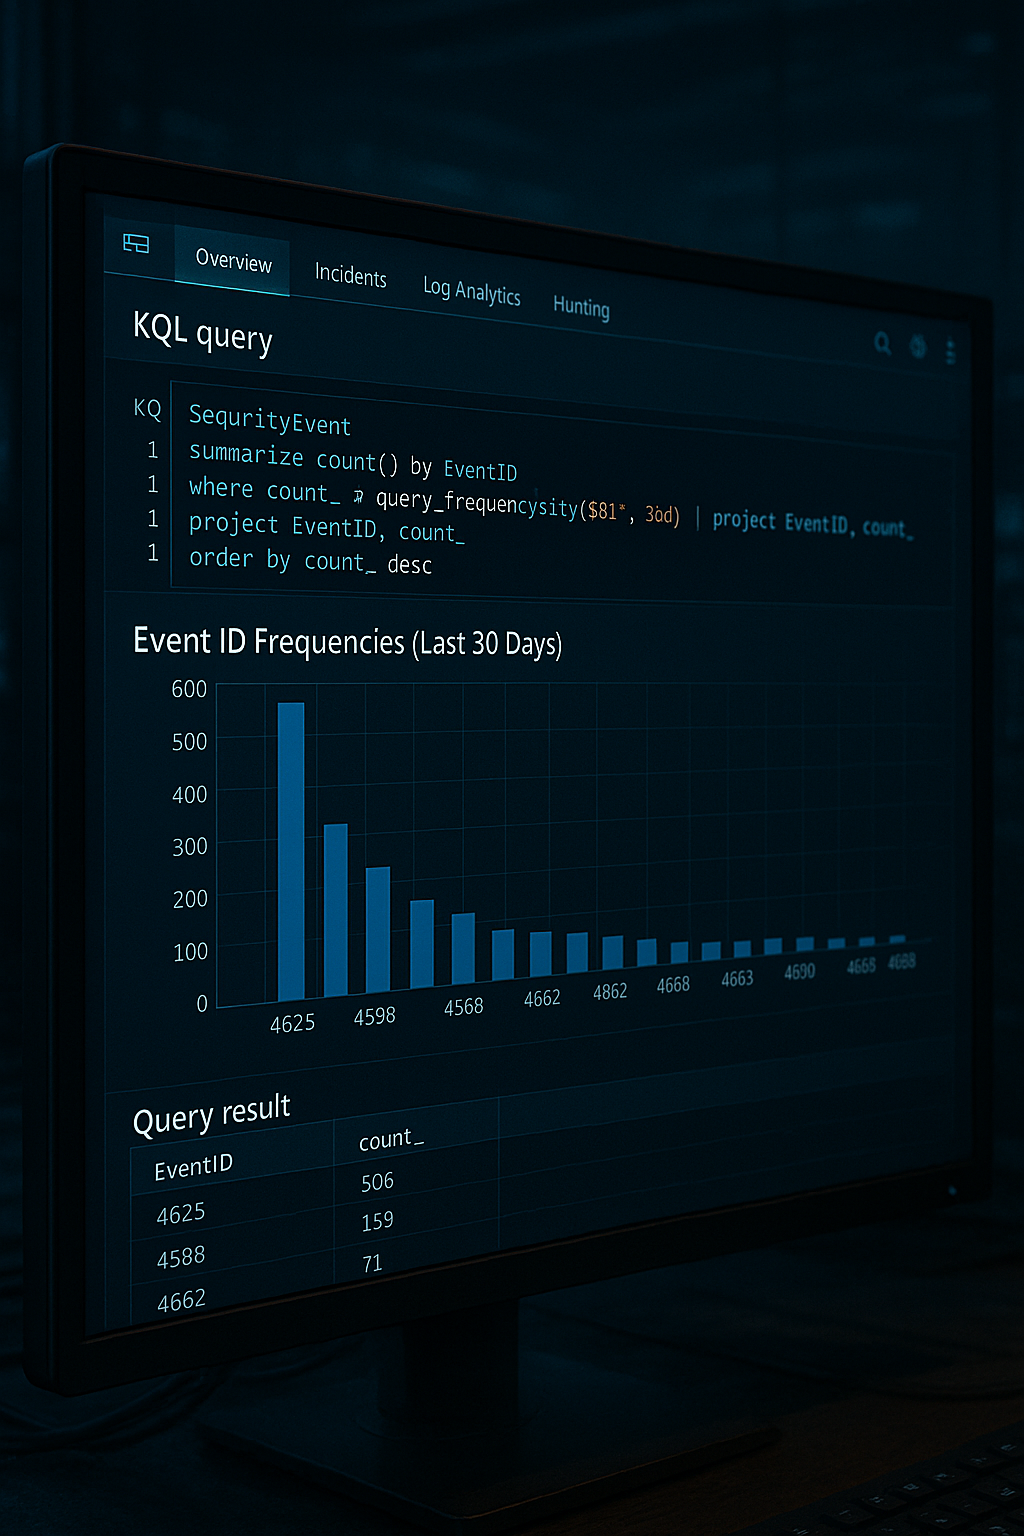
📈 Query #1 — Which Event ID Fires the Most in the Last Month?
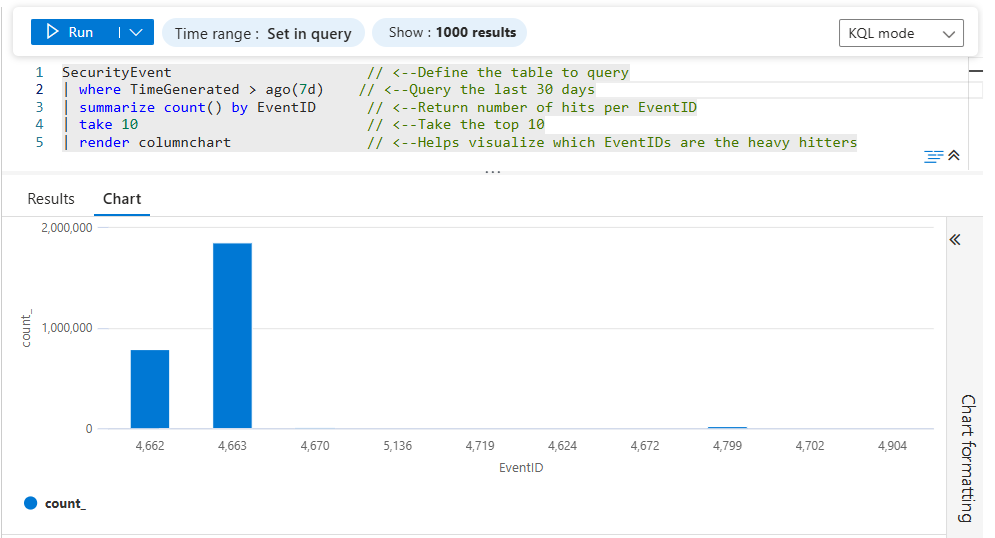
This query counts all SecurityEvent occurrences in the last 30 days and ranks Event IDs by frequency. No filters, no cost calculations — just the raw noise metric.
SecurityEvent                       // <--Define the table to query
| where TimeGenerated > ago(30d)    // <--Query the last 30 days
| summarize count() by EventID      // <--Return number of hits per EventID
| sort by count_ desc               // <--Bring heavy hitters to the top
| take 10                           // <--Take the top 10
| render columnchart                // <--Helps visualize which EventIDs are outliers
🔗 KQL Toolbox #3 — Which EventID fires the most in a month?
🔧 Line-by-Line Breakdown
1️⃣ SecurityEvent
This selects the SecurityEvent table, which contains Windows Security Log events collected from domain controllers, member servers, and workstations. These events include authentication activity, object access, process creation, policy changes, and more — making this table a common source of high-volume ingest in Microsoft Sentinel.
2️⃣ | where TimeGenerated > ago(30d)
This filters the dataset to only events generated in the last 30 days.
- Keeps the query performant
- Focuses analysis on recent and relevant behavior
- Makes results suitable for monthly reporting, tuning reviews, or QBR discussions
💡 You can easily adjust this window (e.g.,
7d,14d,90d) depending on how much history you want to analyze.
3️⃣ | summarize count() by EventID
This is the heart of the query.
- Groups all events by EventID
- Counts how many times each EventID appears in the time window
- Produces a frequency table showing which EventIDs are most common
👉 At this stage, the query transforms raw logs into actionable signal, revealing which event types dominate your environment.
4️⃣ | sort by count_ desc
This sorts the summarized results from highest to lowest count. Without this step, you’d be looking at an arbitrary order — but with it, the loudest EventIDs float to the top, making it immediately clear where your log volume is coming from.
⚠️ This is critical before using
takein the next step. 👇
5️⃣ | take 10
This limits the output to the top 10 EventIDs by volume, focusing on just the top offenders keeps the output:
- Readable
- Actionable
- Ideal for dashboards and quick reviews
💡 In most environments, these 10 EventIDs account for a disproportionate share of SecurityEvent ingest.
6️⃣ render columnchart
This renders the result as a column chart, making patterns instantly visible…
- Each column represents an EventID
- Column height reflects how frequently it occurs
- Outliers and “runaway” events stand out immediately
💡 This visualization is especially useful when presenting findings to stakeholders or deciding where to focus tuning and filtering efforts.
🔎 What You’re Looking For
When you run this query:
- You’ll get a chart of Event IDs ranked by how often they happened in the last 30 days.
- The biggest bars are your “noisiest” events.
- Typical suspects often include event-log-heavy IDs like 4624, 4625, 5156, etc., depending on your environment.
This gives you a quick look at what’s dominating your security log volume.
⚡ Pro-Tip: If you’ve already been tracking ingest costs with last week’s queries, overlay this with Table + Cost ranking and you can start connecting “noise” with “dollars.”
📊 What the Results Will Contain
This output answers one critical question: “What Event IDs dominate my SecurityEvent volume?”
Common examples you’ll often see:
- 4624 – Successful logons
- 4625 – Failed logons
- 4663 – Object access attempts
- 5156 – Windows Filtering Platform traffic
💡 High frequency alone doesn’t mean “bad” — but it does tell you where to look next.
🤔 How to Use the Results
Once you identify your top EventIDs, you can:
- Investigate why they’re so noisy
- Decide whether they’re security-relevant or just operational
- Tune collection policies, analytics rules, or DCRs
- Reduce Sentinel ingest cost without losing meaningful detections
⚔️ Steps to Operationalize
- Run this query weekly or monthly as part of SOC hygiene or cost-review cycles.
- Pin the results to a Sentinel Workbook to track top Event IDs over time.
- Use the output as a pivot point — the top Event ID becomes the input for Queries #2 and #3.
- Combine with cost data from KQL Toolbox #1/#2 to prioritize high-frequency + high-cost Event IDs first.
Outcome: You establish a ranked view of log noise concentration, which is a prerequisite for safe tuning and alert optimization.
🛡️ Framework Mapping
- NIST CSF – DE.CM-1 –> Continuous monitoring of events to understand normal activity patterns.
- NIST CSF – ID.AM-2 –> Supports understanding how systems generate telemetry.
- CIS Control 8.2 –> Ensure logs are reviewed to identify abnormal volumes or patterns.
👤 Query #2 — Which Accounts Are Throwing This Event ID?
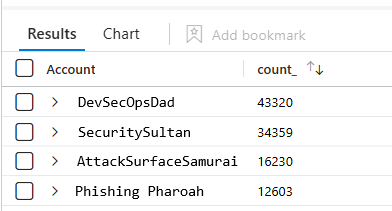
So you found the loudest Event ID… The next step is attribution; let’s see who’s generating it. This second query takes a specific Event ID (in this example 4663) and counts how many times each account triggered it.
// Which Accounts are throwing this EventID?
SecurityEvent                     // <--Define the table to query
| where EventID == 4663         // <--Declare which EventID you're looking for
| summarize count() by Account    // <--Show how many times that EventID was thrown per account
| sort by count_ desc             // <-- Sort by heaviest hitters first
| render columnchart              // <--Optional, but helps quickly visualize potential outliers
🔗 KQL Toolbox #3 — Which Accounts are Throwing this EventID?
🔧 Line-by-Line Breakdown
1️⃣ SecurityEvent
This selects the SecurityEvent table, which contains Windows Security Log data collected from systems such as domain controllers, file servers, and workstations.
Event ID 4663 specifically relates to object access attempts (e.g., files, folders, registry keys), making it a common source of high-volume noise in environments with broad auditing enabled.
2️⃣ | where EventID == 4663
This filters the dataset to only Event ID 4663.
By isolating a single EventID:
- You remove unrelated noise
- Narrow the investigation scope
- Make it easier to attribute behavior to specific actors
⚔️ This line assumes you’ve already identified 4663 as a high-volume or high-interest event worth investigating further.
3️⃣ summarize count() by Account
This groups all 4663 events by Account and counts how many times each account triggered the event.
The result highlights:
- Users accessing large numbers of objects
- Service accounts performing bulk operations
- Potential misconfigurations or runaway processes
🔍 In many cases, you’ll see a small number of accounts responsible for the majority of the volume.
4️⃣ render columnchart
This renders the summarized results as a column chart, making high-volume accounts immediately visible, like…
- Each column represents an account
- Taller columns indicate heavier activity
- Outliers stand out at a glance
🔧 This visualization is especially useful when presenting findings or deciding where to focus remediation or tuning efforts.
🤔 How to Use It
Replace 4662 with the noisy Event ID you found in Query #1, then run the query (in our example we’ll use 4663). You’ll get a visualization of which accounts are responsible for the most of that event.
Once you identify the top accounts generating Event ID 4663, you can:
- Determine whether the activity is expected or excessive
- Identify service accounts that may need narrower permissions
- Tune auditing policies to reduce unnecessary noise
- Exclude known-benign accounts from alerting logic
- Quantify potential Sentinel ingest cost impact
For example:
| Account | Count |
|---|---|
| domain\DevSecOpsDad | 12,350 |
| domain\PhishingPharoah$ | 8,710 |
| domain\SecuritySultan | 6,204 |
| … | … |
| … | … |
If one account is way above the rest, that could be:
- A high-traffic service account you expected
- A misconfigured script
- A potential security issue worth investigating
⚔️ Steps to Operationalize
- Feed the top Event ID from Query #1 into this query.
- Run during:
- Weekly SOC review
- Detection tuning sessions
- Post-incident or post-cost-spike analysis
- To identify:
- Service accounts
- Scheduled jobs
- Over-privileged users
- Tag high-volume accounts as expected, needs tuning, or investigate.
Operational Outcome: You move from what is noisy → who is responsible, enabling targeted remediation instead of blanket suppression.
🚨 Example Alerting
This query becomes powerful when embedded into enrichment, not standalone alerts.
Good patterns:
- Use it as a join in alerting queries to auto-attribute noise.
Feed results into:
- Incident comments
- Automation rules
- Cost-reduction playbooks
Avoid:
- Alerting directly on “top talker accounts” without context.
🛡️ Framework Mapping
- NIST CSF – DE.AE-3 –> Event data is correlated from multiple sources to understand context.
- NIST CSF – PR.AC-4 –> Supports least-privilege validation by identifying overactive accounts.
- CIS Control 6.6 –> Centralized analysis of audit logs with attribution.
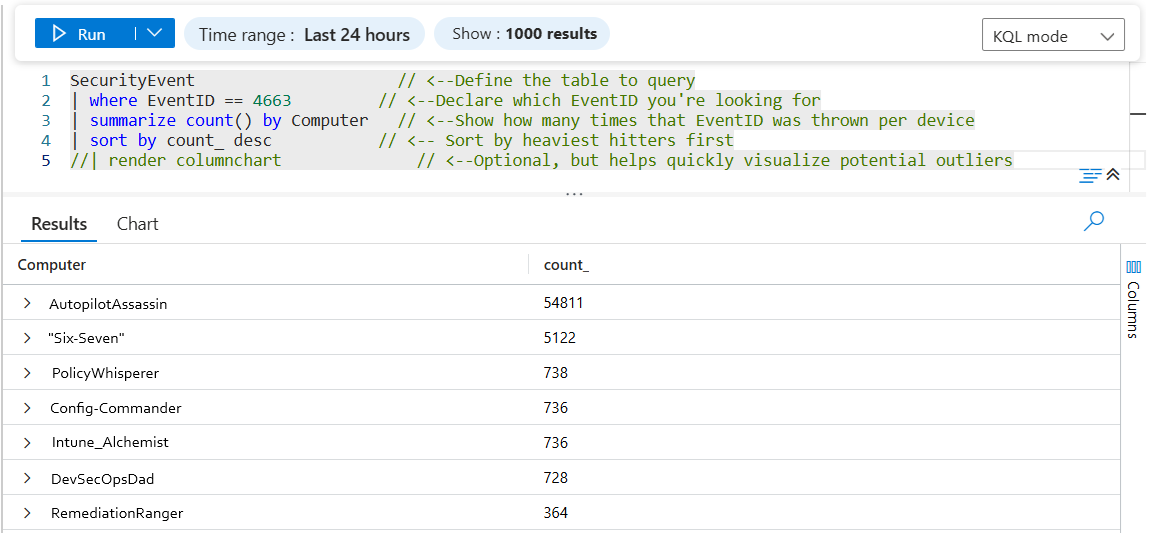
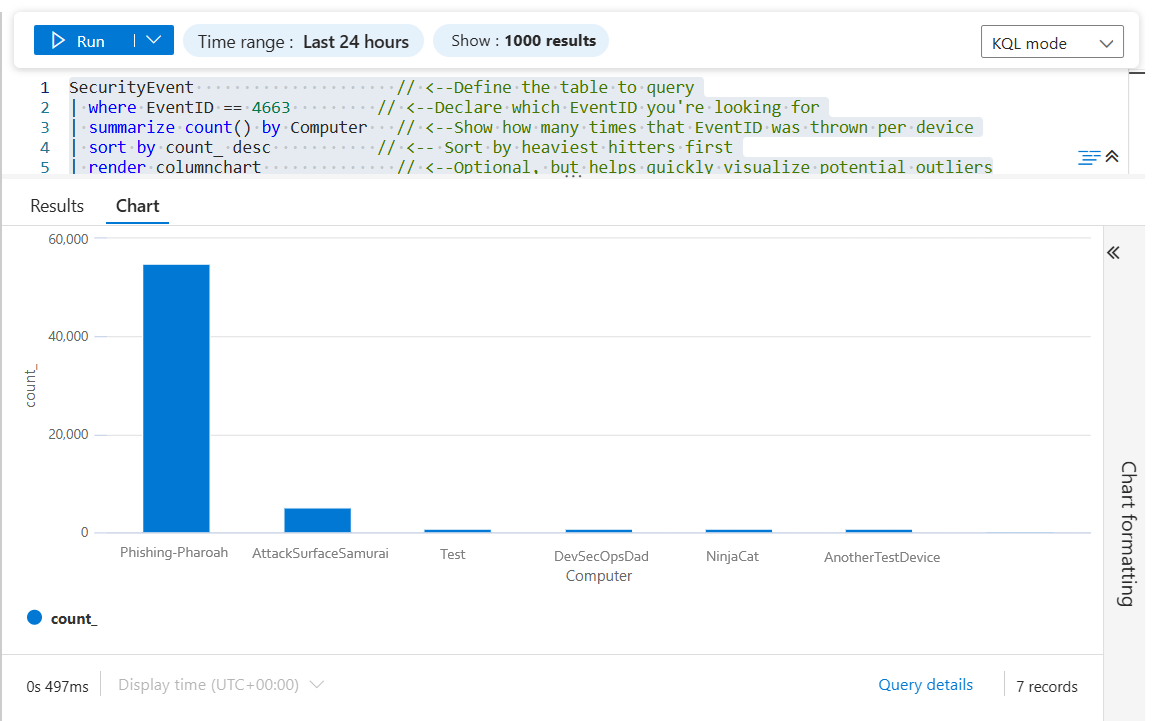
🖥️ Query #3 — Which Devices Are Driving the Noise?
Sometimes the problem isn’t who — it’s where. This query answers a simple but powerful question: “Which computers are generating the most of Event ID 4663?”
4663 = An attempt was made to access an object — commonly used for file/folder auditing noise-hunting and investigation.)
SecurityEvent                     // <--Define the table to query
| where EventID == 4663           // <--Declare which EventID you're looking for
| summarize count() by Computer   // <--Show how many times that EventID was thrown per device
| sort by count_ desc             // <-- Sort by heaviest hitters first
| render columnchart              // <--Optional, but helps quickly visualize potential outliers
🔗 KQL Toolbox #3 — Which Devices are Spamming this EventID?
🔧 Line-by-Line Breakdown
-
SecurityEvent–> This is the Windows Security Event Log table (from Windows event forwarding, AMA, MMA, etc.). If you’re ingesting classic Windows Security logs into Sentinel, this is usually where they land. -
| where EventID == "4663"–> Filters the dataset down to only Event ID 4663 events.-
⚠️ Note: In many workspaces, EventID is stored as a number (int), not a string: so EventID == 4663 is often safer than “4663”.
-
-
| summarize count() by Computer–> Counts how many matching events each device generated, then groups by the Computer field. This instantly exposes your “loudest” devices for that specific event. sort by count_ desc–> Orders the results from highest to lowest based on the event count calculated in the summarize step.- The
count_column is automatically generated by KQL when you usesummarize count()). -
💡 Sorting in descending (desc) order ensures the noisiest devices rise to the top, making problem systems immediately obvious without scanning the entire result set.
- The
| render columnchart–> Turns the results into a quick visual bar chart so the outliers jump out immediately.
⚔️ Steps to Operationalize
Use alongside Query #2 to confirm whether noise is:
- Account-centric
- Device-centric
- Application-centric
Flag devices that:
- Generate disproportionate event volume
- Appear repeatedly across reviews
Feed findings into:
- GPO / audit policy tuning
- Device-level exclusions
- Engineering remediation queues
Operational Outcome: You isolate noisy hosts (file servers, jump boxes, misconfigured systems) without degrading visibility elsewhere.
🚨 Example Alerting
Like Query #2, this works best as supporting context, not a primary trigger.
Good uses:
- Add device attribution to baseline-based alerts.
Auto-populate incidents with:
- Computer name
- Event ID
- Account involved
🛡️ Framework Mapping
- NIST CSF – DE.CM-7 –> Continuous monitoring to detect anomalous system behavior.
- NIST CSF – PR.IP-1 –> Informs secure configuration baselines.
- CIS Control 1.1 / 1.2 –> Asset inventory visibility supports interpretation of log data.
✅ What these queries are good for
Taken together, the four queries in KQL Toolbox #3 form a progressive noise-hunting workflow — moving from “what’s loud?” to “who and what is causing it?”.
They’re particularly effective for:
Noise hunting at scale
- Quickly identify which Event IDs, endpoints, and accounts are responsible for the majority of Windows Security Event volume — without manually digging through raw logs.
Sentinel cost triage
- Once a noisy or expensive Event ID is identified, these queries help you pinpoint exactly where the volume is coming from, which is often just a handful of servers, services, or users driving disproportionate ingest cost.
Misconfiguration detection
- Consistent high-volume events (especially Event ID 4663) frequently reveal:
- Overly broad auditing on hot file shares
- Service or application accounts touching massive numbers of objects
- GPO audit policies applied too widely across the environment
Safe tuning and scoping decisions
- By breaking noise down by
Event ID→device→account, you gain the confidence needed to tune auditing, analytics rules, or data collection — without blindly suppressing potentially valuable security signal.
💡Investigation pivot: These queries are intentionally designed to chain together. Once you identify the loudest Event ID, you can pivot to the noisiest device, then to the accounts generating the activity — and finally down to the files, paths, or access types responsible for the volume.
🧩 Putting It Together: A Simple Weekly Workflow
Here’s how this query fits into a repeatable SOC hygiene loop:
-
1.) Identify expensive tables –> KQL Toolbox #1
-
2.) Identify noisiest log sources –> KQL Toolbox #2
-
3.) Identify top Event IDs –> This article / KQL Toolbox #3
-
4.) Attribute noise to users and systems
- 5.) Decide action
- Tune logging
- Suppress detections
- Investigate behavior
- Reduce ingest cost
- 6.) Re-run monthly to validate improvements
⚡This is a lightweight but powerful way to go from macro-noise patterns to micro-actionables in minutes.
💡 Bonus Tips & Guardrails (Quick Hits)
A few advanced considerations to keep in mind as you work through the queries above:
- Target the right noise –> Authentication-related Event IDs can often be refined further using logon type or success/failure filters.
- Pair noise with cost –> When you correlate noisy Event IDs with ingest cost (from KQL Toolbox #1 and #2), it becomes much easier to prioritize tuning that actually reduces spend.
- **Alert thoughtfully** –> Spikes above a normal baseline can be alert-worthy — but only after you understand what “normal” looks like in your environment.
- Context matters –> High event volume alone doesn’t imply malicious activity. Always validate against expected behavior before tuning or suppressing data.
💡 The next section expands on these tips with concrete examples, best practices, and common pitfalls to avoid when tuning or alerting on Event ID noise. 👇
🚨 Alerting on Event ID Noise Using Baselines
Once you’ve identified your noisiest Event IDs, the real power move is to stop reacting and start detecting change. Instead of alerting on raw volume (which creates noise), we alert on deviation from baseline.
The goal: “Alert me when an Event ID suddenly gets louder than normal.”
🧠 Baseline Strategy (High Level)
We’ll use:
- A historical baseline window (e.g., last 30 days)
- A recent comparison window (e.g., last 24 hours)
- A multiplier threshold (e.g., 2× normal)
This avoids static thresholds and adapts automatically to each environment.
🔍 Step 1: Build a Baseline for Event ID Frequency
This query calculates the average daily count for each Event ID over the last 30 days.
let BaselineWindow = 30d;
SecurityEvent
| where TimeGenerated > ago(BaselineWindow)
| summarize DailyCount = count() by EventID, Day = bin(TimeGenerated, 1d)
| summarize AvgDailyCount = avg(DailyCount) by EventID
What this gives you
- A rolling normal activity baseline
- One row per Event ID
- No assumptions about “good” or “bad” events
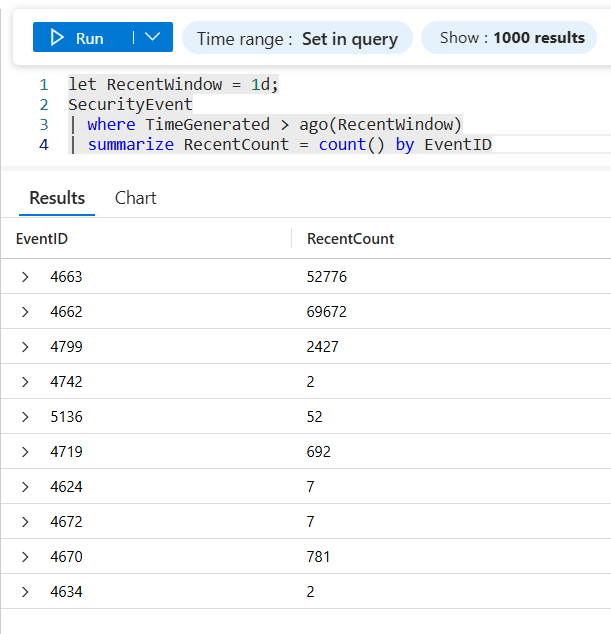
🔎 Step 2: Measure Recent Activity
Now we calculate recent volume (last 24 hours).
let RecentWindow = 1d;
SecurityEvent
| where TimeGenerated > ago(RecentWindow)
| summarize RecentCount = count() by EventID
🔗 Step 3: Compare Recent Activity vs Baseline
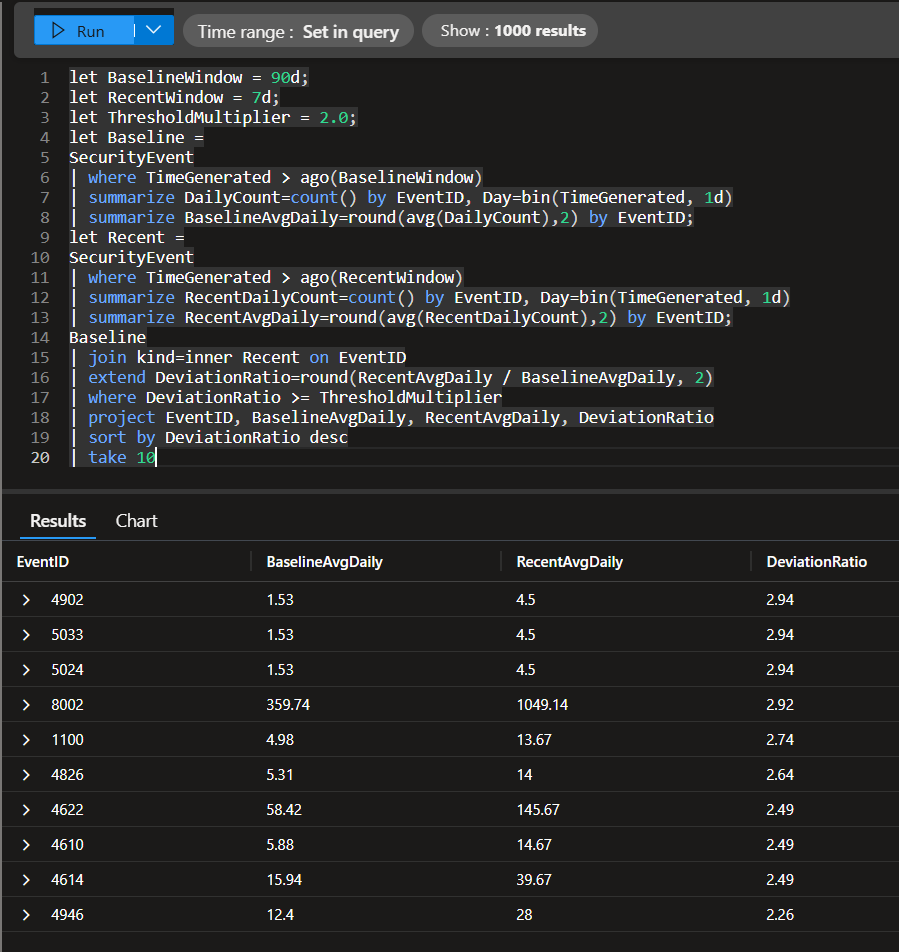
This is where the magic happens. Let’s establish a 90-day “normal” baseline for each Event ID, compare it to the last 30 days, and flag Event IDs whose recent volume is ≥ 2× their typical daily activity.
let BaselineWindow = 90d;
let RecentWindow = 7d;
let ThresholdMultiplier = 2.0;
let Baseline =
SecurityEvent
| where TimeGenerated > ago(BaselineWindow)
| summarize DailyCount=count() by EventID, Day=bin(TimeGenerated, 1d)
| summarize BaselineAvgDaily=round(avg(DailyCount),2) by EventID;
let Recent =
SecurityEvent
| where TimeGenerated > ago(RecentWindow)
| summarize RecentDailyCount=count() by EventID, Day=bin(TimeGenerated, 1d)
| summarize RecentAvgDaily=round(avg(RecentDailyCount),2) by EventID;
Baseline
| join kind=inner Recent on EventID
| extend DeviationRatio=round(RecentAvgDaily / BaselineAvgDaily, 2)
| where DeviationRatio >= ThresholdMultiplier
| project EventID, BaselineAvgDaily, RecentAvgDaily, DeviationRatio
| sort by DeviationRatio desc
| take 10
🔗 KQL Toolbox #3 — Which EventID’s are Suddently Acting Weird?
🔧 Line-by-line breakdown
let BaselineWindow = 90d; → Defines how far back to look when calculating “normal” behavior. Here, normal = the last 90 days of SecurityEvent activity.
let RecentWindow = 7d; → Defines the “recent” comparison window. Here, recent = the last 7 days (a short window that’s good for catching week-over-week changes).
let ThresholdMultiplier = 2.0; → Sets your spike threshold. Any Event ID whose recent average daily volume is 2× or higher than its baseline average daily volume gets flagged.
Baseline dataset
let Baseline = → Starts a reusable dataset named Baseline that will represent “what normal looks like.”
SecurityEvent → Uses the Windows Security Event Log table (your high-volume classic).
| where TimeGenerated > ago(BaselineWindow) → Limits baseline analysis to only events from the last 90 days.
| summarize DailyCount=count() by EventID, Day=bin(TimeGenerated, 1d) → Builds a daily time series per Event ID:
bin(TimeGenerated, 1d)buckets events into 1-day slicescount()counts how many times each EventID appears each dayOutputis one row per (EventID, Day) with DailyCount
| summarize BaselineAvgDaily=round(avg(DailyCount),2) by EventID; → Collapses that daily time series down into a single baseline number per Event ID:
avg(DailyCount) = the average events per day over the 90-day window
round(..., 2) keeps it readable
Output is one row per EventID with BaselineAvgDaily
Recent dataset
let Recent = → Creates a second reusable dataset named Recent that represents “what’s happening lately.”
SecurityEvent → Uses the same source table for a clean apples-to-apples comparison.
| where TimeGenerated > ago(RecentWindow) → Limits recent analysis to the last 7 days.
| summarize RecentDailyCount=count() by EventID, Day=bin(TimeGenerated, 1d) → Builds a daily time series for the recent period (same daily bucketing approach as the baseline).
| summarize RecentAvgDaily=round(avg(RecentDailyCount),2) by EventID; → Produces a single recent number per Event ID:
RecentAvgDaily= the average events per day across the last 7 days- Again: one row per EventID
Compare baseline vs recent
Baseline
| join kind=inner Recent on EventID → Joins the baseline and recent summaries on EventID so you can compare them side-by-side.
kind=inner means you only get Event IDs that exist in both datasets (baseline + recent)
| extend DeviationRatio=round(RecentAvgDaily / BaselineAvgDaily, 2) → Calculates the key metric:
DeviationRatio = how many times louder recent activity is compared to baseline
Interpretation:
- 1.0 ≈ normal
- 2.0 = ~2× louder than baseline
- 5.0 = ~5× louder than baseline
| where DeviationRatio >= ThresholdMultiplier → Filters to only Event IDs whose activity increased beyond your chosen threshold (default 2×).
| project EventID, BaselineAvgDaily, RecentAvgDaily, DeviationRatio → Outputs only the columns you care about in the final result (clean + dashboard-friendly).
| sort by DeviationRatio desc → Sorts so the biggest spikes appear first.
| take 10 → Keeps output tight: top 10 most extreme deviations (great for alert payloads and SOC triage views).
📊 How to Interpret the Results
| Column | Meaning |
|---|---|
| EventID | The event that changed |
| BaselineAvgDaily | Normal daily behavior |
| RecentAvgDaily | What happened recently |
| DeviationRatio | How much louder it got |
Example:
- AvgDailyCount = 5,000
- RecentCount = 15,000
- DeviationRatio = 3.0
👉 This Event ID is 3× louder than normal → investigate.
Steps to Operationalize
Deploy as a Scheduled Analytics Rule in Sentinel.
Recommended cadence:
- Run every 1 hour
- Alert when results > 0
Tune:
BaselineWindowRecentWindowThresholdMultiplier
Maintain a short allowlist of always-noisy Event IDs.
Operational Outcome: You stop alerting on volume and start alerting on change, which dramatically improves SOC signal-to-noise ratio.
Example Alerting Configuration
- Rule Type: Scheduled Query
- Trigger Condition: Results > 0
- Severity Mapping:
- DeviationRatio ≥ 5 → High
- DeviationRatio ≥ 3 → Medium
- DeviationRatio ≥ 2 → Low
- Entity Mapping:
- EventID → Custom entity
- Account / Computer → Enrichment (via join)
💡 This enables alerts like: “Event ID 4663 increased 3.8× baseline — driven by SERVICE-SQL on FILESRV01”
Framework Mapping
- NIST CSF – DE.CM-2 –> Detects anomalies and deviations from expected behavior.
- NIST CSF – DE.AE-1 –> Baselines of network and system operations are established.
- NIST CSF – DE.AE-5 –> Incident alert thresholds are informed by context.
- CIS Control 6.5 –> Use of automated alerting based on log analysis.
- IS Control 8.5 –> Detection rules tuned to reduce false positives.
🛠️ Pro Tips:
- ✅ Exclude Known “Always Noisy” Event IDs:
| where EventID !in ("4624", "4625") - ✅ Scope to a Single Event ID (Targeted Alert) — Perfect for things like 4663 or 4688:
| where EventID == "4663" - ✅ Attribute Noise Automatically (
Account/Device)- Add this at the end of the above query:
| join (
    SecurityEvent
    | where TimeGenerated > ago(RecentWindow)
    | summarize count() by EventID, Account, Computer
) on EventID
👉 Now your alert says: “Event ID 4663 spiked 3.8× — driven by SERVICE-SQL on FILESRV01” for example.

🔗 KQL Toolbox #3 — Which EventID’s are Suddently Acting Weird?
⚠️Stuff to watch out for!
- ❌ Alerting on raw counts
- ❌ No baseline window
- ❌ Ignoring expected maintenance windows
- ❌ Treating all Event IDs equally
💪 This approach avoids all four.
👉 Static thresholds create noise. Baselines create signal. Once you alert on change, not volume, your SOC matures instantly.
🎁 Wrap-Up & Final Thoughts
Two focused queries. One powerful feedback loop:
- Identify the loudest Event ID
- Pinpoint the accounts or devices generating it
- Tune collection, alerting, or investigations with intent — not guesswork
Cost visibility tells you where your money goes. 💸 Noise analysis tells you where your attention should go 👀.
When you bring those together, you stop reacting to volume and start engineering a leaner, clearer, more effective SOC — one that prioritizes signal over chaos.
But here’s the next evolution: knowing what’s loud is only half the battle.
In KQL Toolbox #4, we take the next step and ask the question every SOC eventually faces: “What changed?” 📈⚠️
You’ll learn how to spot sudden deltas in log volume and cost, catch misconfigurations early, and surface the exact data sources responsible for unexpected spikes — before they blow up your budget or your alert queue. 🤑
👉 Stay curious, stay efficient, and keep your signals intentional, actionable, and under control. 😼🥷🔊
📚 Want to go deeper?
From logs and scripts to judgment and evidence — the DevSecOpsDad Toolbox shows how to operate Microsoft security platforms defensibly, not just effectively.
🛠️ KQL Toolbox: Turning Logs into Decisions in Microsoft Sentinel

🧰 PowerShell Toolbox: Hands-On Automation for Auditing and Defense
📖 Ultimate Microsoft XDR for Full Spectrum Cyber Defense
Real-world detections, Sentinel, Defender XDR, and Entra ID — end to end.
🔗 Helpful Links & Resources
- 🛠️ Kql Toolbox #1: Track & Price Your Microsoft Sentinel Ingest Costs
- 🛠️ Kql Toolbox #2: Find Your Noisiest Log Sources (with Cost 🤑)
- ⚡ KQL Query: Which EventID fires the most in a month?
- ⚡ KQL Query: Which Accounts are throwing this EventID?
- ⚡ KQL Query: Which Devices are Throwing this EventID?
- ⚡ KQL Query: Which Event IDs Are Suddenly Acting Weird?
- 📚 Logging and Threat Detection - Microsoft Learn
- 😼 Legend of Defender Ninja Cat
Other Fun Stuff…
- 🧰 Powershell Toolbox Part 1 Of 4: Azure Network Audit
- 🧰 Powershell Toolbox Part 2 Of 4: Azure Rbac Privileged Roles Audit
- 🧰 Powershell Toolbox Part 3 Of 4: Gpo Html Export Script — Snapshot Every Group Policy Object In One Pass
- 🧰 Powershell Toolbox Part 4 Of 4: Audit Your Scripts With Invoke Scriptanalyzer
