Welcome back to KQL Toolbox 👋
In KQL Toolbox #1, we learned how to measure Microsoft Sentinel ingest and translate it into real operational dollars. In KQL Toolbox #2, we identified which data sources were driving that cost. In KQL Toolbox #3, we drilled all the way down to specific Event IDs, accounts, and devices generating noise. In KQL Toolbox #4, we shifted from what’s expensive to what changed — helping you pinpoint where billable log volume spiked or dropped and why. All of those entries were about understanding your telemetry’s shape, its motion, and its financial impact — which is crucial for cost governance and operational hygiene.
But once you’ve got data quality, cost, and delta analysis in your toolkit, one question always pops up: “Okay… now what threats are actually showing up in my telemetry?” This is where phishing and malware hunting steps in… Email is the #1 vector in most real-world intrusions. Whether it’s a clever social-engineering campaign or a payload-laden attachment trying to evade detection, getting fast, prioritized insight into who is being targeted, who the most aggressive senders are, and which users or domains are seeing the most malicious activity is mission-critical for defenders.
So in this week’s KQL Toolbox entry, we take your hunting game to the next level:
- We filter email telemetry for phishing-classified events,
- Tally up which recipients are getting hammered the hardest,
- Identify the sender domains driving that activity,
- And add severity buckets so you can triage, prioritize, and act fast.
Instead of just collecting logs, you’ll now be extracting actionable threat signals that help you spot campaigns, escalate investigations, and harden your defenses where it matters most. Whether you’re defending an enterprise email stack or building out detections in Microsoft Defender XDR / Advanced Hunting, this set of queries gives you a practical starting point for turning noisy mail telemetry into targeted threat insights.
⚡ This isn’t just counting emails — it’s hunting the ones that matter.

Today’s KQL helps you identify “Which recipients are getting hit with the most phishing emails, and which sender domains are responsible — with a quick severity label so I can triage fast?”
We accomplish that by:
- filtering email telemetry to phishing-tagged events,
- counting them per RecipientEmailAddress + SenderFromDomain,
- assigning “severity” buckets based on count thresholds,
- sorting and returning the top 10 highest-volume combos,
- formatting output for human readability.
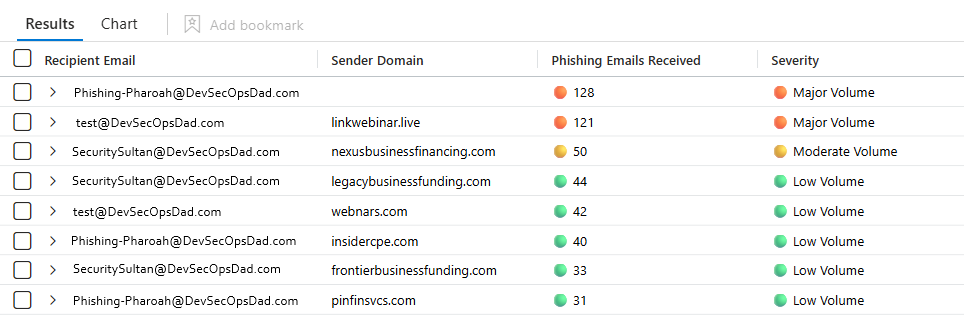
Query 1 — Identify top recipients of phishing emails and categorizes severity based on volume
EmailEvents
| where ThreatTypes has "Phish"
| summarize PhishCount = count() by RecipientEmailAddress, SenderFromDomain
// Assign severity level indicators based on PhishCount
| extend SeverityIndicator = case(
                                 PhishCount >= 500,
                                 "🔥 Extreme Volume",
                                 PhishCount >= 200,
                                 "🔴 Critical Volume",
                                 PhishCount >= 100,
                                 "🟠 Major Volume",
                                 PhishCount >= 50,
                                 "🟡 Moderate Volume",
                                 "🟢 Low Volume"
                             )
// Apply color coding to PhishCount
| extend CountColor = case(
                          PhishCount >= 500,
                          "🔥",
                          PhishCount >= 200,
                          "🔴",
                          PhishCount >= 100,
                          "🟠",
                          PhishCount >= 50,
                          "🟡",
                          "🟢"
                      )
// Sort by the highest volume of phishing emails received
| top 10 by PhishCount desc
// Improve column naming for readability
| project
    ["Recipient Email"] = RecipientEmailAddress,
    ["Sender Domain"] = SenderFromDomain,
    ["Phishing Emails Received"] = strcat(CountColor, " ", PhishCount),
    ["Severity"] = SeverityIndicator
🔗Get the query here
Line-by-line technical breakdown 👇
EmailEvents
This is your starting table.
In Microsoft Defender XDR advanced hunting, EmailEvents represents email message-level telemetry (think: “an email event exists” plus metadata). It’s not attachment events and not URL click events — those are other tables (commonly EmailAttachmentInfo, EmailUrlInfo, etc., depending on schema).
Key point: you’re starting at the event grain of “email message activity”, which is appropriate for “volume received”.
| where ThreatTypes has "Phish"
This filters the dataset down to only rows where the ThreatTypes field contains “Phish”.
has is a token-based search operator. It’s optimized for “contains word/token”. It’s usually a good fit when the field is a string that may contain multiple threat labels (e.g., Phish, Malware, Spam, etc.) or a semi-structured list. If ThreatTypes is something like “Phish;Spam” or “Spam, Phish”, this will still match.
What this means operationally:
- You’re relying on whatever detection/classification pipeline populated ThreatTypes.
- This is not “user reported phish” by default; it’s “the system labeled this email as phish-related”.
Gotcha: If your environment uses different labeling (example: “Phishing” vs “Phish”), this filter may undercount. If ThreatTypes can be empty or null sometimes, those simply won’t match.
| summarize PhishCount = count() by RecipientEmailAddress, SenderFromDomain
What summarize does:
- It groups rows by the fields listed after by.
- For each group, it calculates aggregations (here: count()).
- It outputs one row per group.
We’re grouping by TWO fields:
RecipientEmailAddressSenderFromDomain
So the output is: “Top recipient + sender-domain pairs”
⚠️ That’s important: If one user gets 1,000 phish from 50 different domains (20 each), they will not appear as 1,000. They’ll appear as many smaller rows. Conversely, if one domain hammers one user repeatedly, that combo will jump to the top — which is usually what you want if you’re trying to block/suppress a campaign source.
PhishCount = count()
Counts rows in each group and give it the alias PhishCount for readability.
| extend SeverityIndicator = case( ... )
Extend adds a new calculated column (or overwrites an existing one if the same name is used). Here, you’re creating a string label based on thresholds.
How case() works in KQL:
case(condition1, value1, condition2, value2, ..., defaultValue) –> evaluates conditions in order…
- First match wins
- If none match, it returns the default.
Our logic is as follows…
PhishCount >= 500 → "🔥 Extreme Volume"

else if >= 200 → "🔴 Critical Volume"

else if >= 100 → "🟠 Major Volume"

else if >= 50 → "🟡 Moderate Volume"

else → "🟢 Low Volume"
- 💡 Why the order matters: If you put
PhishCount >= 50 first, then aPhishCount=500row would match that first and never reach the “Extreme” label. Our ordering is highest threshold first.
- 🔎 Why this is useful: Now your output can be read by humans quickly without doing mental math: “Okay, that’s 🔥/🔴 — I should look at that first.”
| extend CountColor = case( ... )
This is basically the same thresholds again, but returning a single emoji marker.
We now have:
SeverityIndicator(emoji + label)CountColor(emoji only)
This is redundant on purpose because we use CountColor later to decorate the numeric count column - This is a common “SOC dashboard trick”: you don’t need conditional formatting support if you embed the indicator into the string.
| top 10 by PhishCount desc
top is like using sort by ... followed by | take 10, but optimized and concise in a single command.
- by PhishCount desc sorts highest first.
- top 10 returns only the first 10 rows.
💡 Important detail: This is “top 10 recipient+domain pairs” after aggregation. So the output is the 10 highest-volume hotspots.
| project ...
project shapes the final output columns: rename, reorder, compute new display values, and drop everything else.
We’re doing four things here:
- 1.)
["Recipient Email"] = RecipientEmailAddress- Renames RecipientEmailAddress to “Recipient Email”.
- Square-bracket quoting is required because the column name contains spaces. This is KQL’s friendly display-name style.
- 2.)
["Sender Domain"] = SenderFromDomain- Same idea: user-friendly heading.
- 3.)
["Phishing Emails Received"] = strcat(CountColor, " ", PhishCount)- This is the “pretty output” trick.
strcat()concatenates values into a string.- Put the emoji first, then a space, then the count.
- So instead of 245, you get: “🔴 245”
- ⚠️ Gotcha: Because this becomes a string, you can’t sort numerically on this display column anymore. But we already sorted earlier using PhishCount, so we’re fine. If you ever wanted to chart this later, you’d keep numeric PhishCount as a separate projected column too. Check out my earlier discussion on this nuance in KQL Toolbox #1.
- 4.)
["Severity"] = SeverityIndicator- Final friendly severity label.
- What the output actually represents
- Each returned row means:
- Recipient X received N phishing-labeled email events
- specifically from Sender Domain Y
- and N falls into a severity bucket
So this is extremely good for:
- spotting targeted users being hammered by a specific campaign domain
- identifying domains to block (or to investigate for spoofing / lookalike patterns)
- identifying users who might need extra protections/training (or are being specifically targeted)
Practical SOC interpretation tips:
High volume to one recipient from one domain can indicate:
- a campaign repeatedly attempting delivery
- repeated re-sends with minor variations
- a compromised sender domain blasting the org
- a lookalike domain you should block fast
High volume spread across many domains might indicate:
- “recipient is a public-facing mailbox” (careers@, info@, support@)
Why this query matters:
This query helps defenders zero in on specific attacker-to-victim paths by showing where phishing pressure is disproportionately high from particular domains toward particular users. Instead of just knowing a user is targeted, you see who is doing the targeting — which enables faster decisions about domain blocks, mail transport rules, and investigation priorities. In real investigations, repeated hits from the same domain often signal a concerted campaign or automated blast infrastructure that’s worth immediate containment action.
⚡ Steps to Operationalize:
Identify users who are disproportionately targeted by phishing campaigns so you can prioritize protection, awareness, and monitoring.
- Run cadence: Weekly (SOC hygiene) and monthly (trend review)
- Visualize: Sentinel Workbook showing:
- Top recipients
- % of total phishing volume
- Trend over time
- Baseline: Establish a “normal” recipient distribution; alert only on new or sudden targeting shifts
⚔️ SOC Actions:
Validate whether targets are:
- Executives
- Finance / payroll
- IT admins
- Shared mailboxes
Cross-reference with:
- MFA status
- Conditional Access policies
- Past incidents or credential-theft attempts
🛡️ Defensive Controls to Trigger:
- Tighten Conditional Access for heavily targeted users
- Enable enhanced phishing protections (Safe Links, Safe Attachments)
- Add targeted awareness training (not org-wide spam)
👉 Outcome: You shift from “everyone gets phished” to focused protection for high-risk users, reducing blast radius and response fatigue.

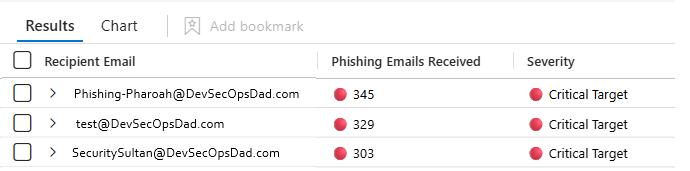
Query #2 — “Which recipients are getting the most phishing emails (by volume), and how severe is the targeting?”
In the last query, we answered a very actionable question: “Which recipient + sender domain pairs are generating the most phishing volume?” That pairing is clutch when you’re trying to quickly identify a campaign source and decide what to block, quarantine, or hunt further.
But sometimes you need to zoom out and ask a simpler, more strategic question: “Who are my top targeted users overall — regardless of where the phish is coming from?”
That’s exactly what this next query does. Instead of splitting counts across sender domains, it rolls everything up by recipient, giving you a clean “Top 10 most targeted mailboxes” view that’s perfect for triage, VIP protection, training prioritization, and focus-based investigation.
EmailEvents
| where ThreatTypes has "Phish"
| summarize PhishCount = count() by RecipientEmailAddress
// Assign severity level indicators based on PhishCount
| extend SeverityIndicator = case(
                                 PhishCount >= 500,
                                 "🔥 Extreme Target",
                                 PhishCount >= 200,
                                 "🔴 Critical Target",
                                 PhishCount >= 100,
                                 "🟠 Major Target",
                                 PhishCount >= 50,
                                 "🟡 Moderate Target",
                                 "🟢 Low Target"
                             )
// Apply color coding to PhishCount
| extend CountColor = case(
                          PhishCount >= 500,
                          "🔥",
                          PhishCount >= 200,
                          "🔴",
                          PhishCount >= 100,
                          "🟠",
                          PhishCount >= 50,
                          "🟡",
                          "🟢"
                      )
// Sort by the highest volume of phishing emails received
| top 10 by PhishCount desc
// Improve column naming for readability
| project
    ["Recipient Email"] = RecipientEmailAddress,
    ["Phishing Emails Received"] = strcat(CountColor, " ", PhishCount),
    ["Severity"] = SeverityIndicator
It’s a “who is being targeted the most” ranking query — and it’s intentionally recipient-centric, not campaign-centric.
🔗 Grab the full query here
Line-by-line technical breakdown 👇
EmailEvents
This is your source table — the email telemetry backbone.
Each row represents an email-related event record with fields that can include:
- sender / recipient addressing
- delivery actions
- threat classifications (like your ThreatTypes)
- message metadata
| where ThreatTypes has "Phish"
This is our filter: only phishing-labeled email events survive.
Why this matters:
- Everything downstream (counts, top 10, severity) is only as good as this filter.
- You’re trusting the platform’s classification pipeline that populates ThreatTypes.
Why has is used:
- It matches tokens inside a larger string (helpful if ThreatTypes contains multiple labels like “Phish;Spam”).
- It’s typically more efficient/appropriate than a fuzzy “contains-like” approach when the field is token-ish.
| summarize PhishCount = count() by RecipientEmailAddress
This is the big change vs the previous query.
What summarize is doing:
- Groups all phishing events by RecipientEmailAddress
- Counts how many phishing email events each recipient had
- Outputs one row per recipient
What this solves:
- This gives you the true total volume per user.
So instead of: Ian got 20 from domainA, 15 from domainB, 40 from domainC…
You now get: Ian got 75 total phishing emails.
This is excellent for:
- identifying who needs extra protection (VIP mailbox, exec, finance/AP)
- spotting mailboxes that are hammered (info@, jobs@, support@)
- focusing investigations (“Why is THIS one mailbox getting hit so hard?”)
| extend SeverityIndicator = case( ... )
We’re creating a severity label called SeverityIndicator.
Key mechanics:
- extend adds a new calculated column
- case() evaluates conditions top-to-bottom (first match wins)
- The last string is the default if none match
Your thresholds:
| Count | Interpretation |
|---|---|
| >= 500 | 🔥 Extreme Target |
| >= 200 | 🔴 Critical Target |
| >= 100 | 🟠 Major Target |
| >= 50 | 🟡 Moderate Target |
| else | 🟢 Low Target |
👆 Adjust the Count thresholds to the size of your organization so this actually means something!
| extend CountColor = case( ... )
This repeats the same threshold logic, but returns a single emoji.
So later, you can build output like:
- 🔴 245
- 🟡 61
This is a “portable conditional formatting” trick — especially handy when results are pasted into tickets, email, or screenshots.
Next, we rank the hottest targets with | top 10 by PhishCount desc
This returns only the 10 highest PhishCount recipients. Result expectation: This produces our “Top 10 targeted users” list.
Now we convert technical column names into human-friendly headers with | project ...
project is where we “finalize” the output.
["Recipient Email"] = RecipientEmailAddress–> Renames the column to a clean display name with spaces.["Phishing Emails Received"] = strcat(CountColor, " ", PhishCount)–> This builds a formatted string like:- 🔥 612
- 🟠 143
Important nuance (again): This makes the displayed value a string. That’s fine here because:
- we already did our numeric sort using PhishCount
- we’re optimizing output for human consumption
Check out this discussion in this PRIOR KQL TOOLBOX Article #.
["Severity"] = SeverityIndicator
Adds the labeled bucket we created earlier.
What the output represents (plain English)… Each row now means:
- “This recipient received N phishing-classified emails in the query time window (whatever your hunting UI defaults to), and N maps to this severity bucket.”
This is a clean “who’s getting hammered” scoreboard.
Why this query matters:
Some users are magnets for malicious email — executives with publicly exposed addresses, shared inboxes like info@ or support@, and compromised accounts included on internal lists. This query collapses sender domains to show total phishing exposure per recipient, giving defenders a cleaner view of who’s under the most attack regardless of source. This perspective is useful for prioritization when time or resources are limited.
⚡ Steps to Operationalize:
Surface sender domains responsible for sustained or repeated phishing attempts.
- Run cadence: Daily for hunting, weekly for reporting
- Track: Domain recurrence and growth rate (new vs persistent domains)
- Tag Domains as:
- Known malicious
- Newly emerging
- Opportunistic spray-and-pray
⚔️ SOC Actions:
- Enrich domains with:
- WHOIS age
- Threat intel feeds
- Previous block history
- Identify:
- Campaign reuse
- Infrastructure rotation patterns
🛡️ Defensive Controls to Trigger:
- Block domains at:
- Microsoft 365 Defender
- Secure Email Gateway
- DNS layer
- Create temporary watchlists for domains showing accelerating volume
👉 Outcome: You move from reactive mailbox cleanup to campaign-level disruption, breaking phishing infrastructure early.

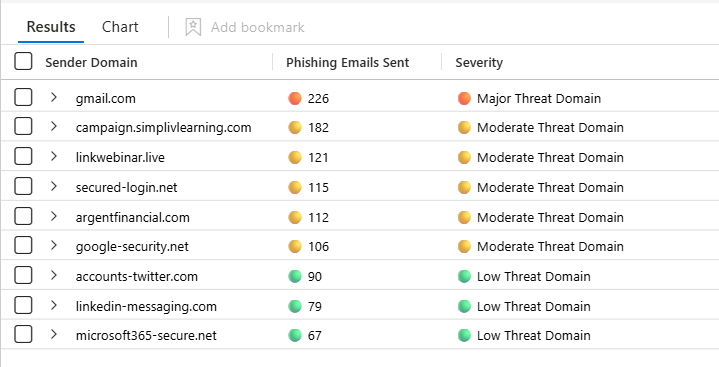
Query #3 — “Top Threat Sender Domains”
Now that we’ve identified which mailboxes are being targeted most heavily, the next logical question is: “Okay… who’s doing the targeting at scale?”
Because protecting users is only half the battle — the other half is shutting down the source. This next query flips the perspective from recipient-centric to threat-infrastructure-centric, showing you which sender domains are responsible for the most phishing volume across your entire environment. That’s exactly the view you want for:
- rapid domain blocking / allow-block policy decisions
- threat intel enrichment and clustering
- proving a campaign’s scale in an incident summary (“this domain hit us 800 times in 24 hours”)
This query answers: “Which sender domains are responsible for the highest volume of phishing emails (as classified by the platform)?”
It’s a “top offender domains” query — ideal for finding repeat infrastructure and prioritizing blocking and investigation.
EmailEvents
| where ThreatTypes has "Phish"
| summarize PhishCount = count() by SenderFromDomain
// Assign severity level indicators based on PhishCount
| extend SeverityIndicator = case(
                                 PhishCount >= 1000,
                                 "🔥 Extreme Threat Domain",
                                 PhishCount >= 500,
                                 "🔴 Critical Threat Domain",
                                 PhishCount >= 200,
                                 "🟠 Major Threat Domain",
                                 PhishCount >= 100,
                                 "🟡 Moderate Threat Domain",
                                 "🟢 Low Threat Domain"
                             )
// Apply color coding to PhishCount
| extend CountColor = case(
                          PhishCount >= 1000,
                          "🔥",
                          PhishCount >= 500,
                          "🔴",
                          PhishCount >= 200,
                          "🟠",
                          PhishCount >= 100,
                          "🟡",
                          "🟢"
                      )
// Sort by the highest volume of phishing emails sent from a domain
| top 10 by PhishCount desc
// Improve column naming for readability
| project
    ["Sender Domain"] = SenderFromDomain,
    ["Phishing Emails Sent"] = strcat(CountColor, " ", PhishCount),
    ["Severity"] = SeverityIndicator
🔗 Grab the query here
Line-by-line technical breakdown 👇
EmailEvents
Your base email telemetry table again. Same logic as before: this table is appropriate because we’re counting email events and their threat classification at message level.
| where ThreatTypes has "Phish"
Filter down to phishing-labeled email events. This keeps the analysis scoped to what the detection pipeline has already classified as phishing-related.
Why it’s important here: If you don’t filter, you’ll just get your “top sender domains overall” (which is usually dominated by normal business mail sources, marketing platforms, etc.). This where clause makes the output threat-focused.
| summarize PhishCount = count() by SenderFromDomain
This is the key shift; What summarize does here:
- Groups all phishing email events by SenderFromDomain
- Counts how many phishing-labeled events came from each sender domain
- Outputs one row per sender domain
This gives us a ranked list of domains that show up repeatedly as the apparent sender domain in phishing-tagged emails.
⚠️ Important nuance
This is “SenderFromDomain” — which reflects the domain portion of the “From” identity as captured in telemetry. In real-world phishing:
- the visible “From” domain can be spoofed
- the envelope sender / return-path can differ
- the sending infrastructure might be entirely different
So treat this output as:
- highly actionable for “block/suppress” decisions, and
- a starting pivot point, not the only truth.
| extend SeverityIndicator = case( ... )
Now we bucket severity again, but with thresholds tuned for domain-level volume. Our thresholds are higher than the recipient query, and that’s logical:
- A single mailbox getting 200 phish is bad
- A single domain generating 500–1000 phish events org-wide is an “infrastructure at scale” signal
Buckets:
| Count | Interpretation |
|---|---|
| >= 1000 | 🔥 Extreme Threat Domain |
| >= 500 | 🔴 Critical Threat Domain |
| >= 200 | 🟠 Major Threat Domain |
| >= 100 | 🟡 Moderate Threat Domain |
| else | 🟢 Low Threat Domain |
As before:
- ordering matters (highest threshold first)
case()stops on first match
| extend CountColor = case( ... )
Same thresholds again, but returns only an emoji indicator. This is purely for human scan-ability in the final table.
| top 10 by PhishCount desc
This ranks domains by highest phishing volume and returns the top 10 and creates our “worst offenders” list — the domains we should:
- enrich with TI (reputation / age / registration)
- see if they map to known campaigns
- evaluate for blocking at mail gateway / Defender policies
| project ...
Final formatting and cleanup.
["Sender Domain"] = SenderFromDomain
Display-friendly renaming.
["Phishing Emails Sent"] = strcat(CountColor, " ", PhishCount)
This creates the formatted output string like:
- 🔥 1422
- 🟠 273
Again: string formatting is fine because sorting already happened on the numeric
PhishCount.
["Severity"] = SeverityIndicator
This shows our bucket label.
Each row represents: “This sender domain appeared in N phishing-classified email events (in the query time window) across the environment — and here’s the severity bucket based on volume.”
This is your top phishing domain offenders list.
⚡ Steps to Operationalize
Determine which mailboxes are being singled out across phishing campaigns — beyond just raw event counts.
- Run cadence: Weekly
- Correlate with Query #1 to confirm whether:
- High targeting = high engagement
- Or simply high exposure
- Track changes over time:
- New users appearing
- Sudden targeting of dormant accounts
⚔️ SOC Actions:
- Investigate:
- Mailbox forwarding rules
- Inbox rule abuse
- Credential-phishing success indicators
- Prioritize users for:
- Threat hunting
- Password resets
- Session revocation (if required)
🛡️ Defensive Controls to Trigger:
- Temporary mailbox-level alerting for repeat targets
- Enhanced logging for targeted users during active campaigns
- Focused incident response playbooks
👉 Outcome: You identify human choke points in phishing campaigns instead of treating phishing as a generic email problem.

Bonus Discussion: “Okay… what about malware email?”
Up to this point, we’ve been treating phishing like a volume-and-targeting problem: who’s getting hammered, and which domains are doing the hammering. But in the real world, phish is often just the delivery vehicle — the “click this” lure — while malware email is the “payload problem.”
So as a bonus lens, this next query pivots from phish targeting to:
“Which recipients are receiving malware-labeled emails, from which domains, and how is that trending day-by-day?”
That’s a really practical add-on because it’s inherently more “incident-y” — malware emails tend to correlate more directly with containment actions and escalation.
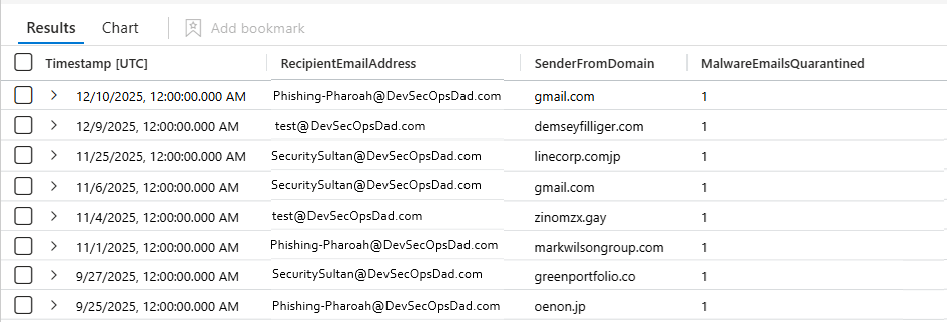
EmailEvents
| where ThreatTypes has "Malware"
| summarize MalwareEmailsQuarantined = count() by bin(Timestamp, 1d), RecipientEmailAddress, SenderFromDomain
| order by Timestamp desc
🔗 Grab the full KQL here
This query answers:
- When (by day) are malware-classified emails showing up?
- Who is receiving them?
- Which sender domains are associated?
- And what’s the volume per day per recipient per domain?
It’s essentially a daily “malware mail heatmap feed” you can use for:
- spotting outbreaks (sudden day-over-day spikes)
- identifying repeated targeting patterns
- validating effectiveness of quarantine rules
- incident reporting (“we quarantined X malware emails yesterday”)
Line-by-line technical breakdown 👇
EmailEvents
Same base table as before: we’re querying email telemetry at the message/event level. This is the right base for “how many emails of type X happened.”
| where ThreatTypes has "Malware"
Filter to only events where ThreatTypes includes the token “Malware”.
What we’re relying on
- This assumes the platform’s classification labeled the email as malware-related.
- “Malware” here is a threat category label, not necessarily “we confirmed execution happened.”
Why has again…
Same reason as phish: if ThreatTypes contains multiple values, has will still match when Malware is present.
| summarize MalwareEmailsQuarantined = count() by bin(Timestamp, 1d), RecipientEmailAddress, SenderFromDomain
This is doing three important things at once:
- 1.)
count()→ a volume metric- MalwareEmailsQuarantined = count() counts the number of malware-labeled email event rows in each group.
- We alias it to a human-readable metric name. Great.
- 2.)
by RecipientEmailAddress, SenderFromDomain→ who + from where
Just like our earlier phish pair query, we keep the two pivot keys:
- Recipient (target)
- Sender domain (apparent source)
That makes it immediately actionable.
- 3.)
bin(Timestamp, 1d)→ daily time-bucketing
This is the real “trend” part. Timestamp is the time field we’re aggregating across. bin(Timestamp, 1d) rounds timestamps down into daily buckets (midnight boundaries in the query’s time context).
So instead of having scattered per-message timestamps, we get:
- 2025-12-16: recipientA + domainX = 12
- 2025-12-15: recipientA + domainX = 3
- etc.
That is perfect for:
- trending
- charting
- spotting “it started yesterday” patterns
| order by Timestamp desc
This sorts results so the newest day is at the top.
Important nuance: after summarizing, the Timestamp column is now the binned timestamp (the bucket start time). So ordering desc means:
- most recent day bucket first
- This is exactly what you want when scanning recent activity.
- What the output represents (plain English)
Each output row means: “On this day, this recipient received N malware-labeled emails associated with this sender domain.”
It’s not just “top 10 offenders” — it’s a time series of malware email activity broken down by recipient and domain.
Practical SOC use-cases
- Outbreak detection: “We jumped from 2/day to 40/day today — what changed?”
- Targeted malware campaigns: “Why is one mailbox repeatedly receiving malware payload emails?”
- Infrastructure clustering: “Is the same sender domain showing up across multiple recipients day-over-day?”
- Reporting: “How many malware emails did we see and contain per day this week?”
⚡ Steps to Operationalize:
- Detect trends, spikes, and delivery waves for malware-laden emails:
- Run cadence: Daily (chart-based)
- Visualize: Time-series dashboard showing:
- Daily malware volume
- Spikes vs baseline
- Baseline: Establish normal daily malware volume per environment
⚔️ SOC Actions:
- Investigate spikes by:
- Sender domain
- Attachment type
- Malware family (if available)
- Correlate with:
- Endpoint alerts
- User clicks
- Device compromise indicators
🛡️ Defensive Controls to Trigger:
- Alert only on spikes, not absolute counts
- Increase attachment scanning or detonation during active waves
- Escalate incident severity if malware delivery aligns with endpoint detections
👉 Outcome: You stop reacting to “there was malware” and start responding to malware campaigns, reducing alert noise and improving timing.

🛠️ Operationalizing These Queries — with CIS & NIST Mapping
The real power of these queries isn’t just detection — it’s governance-aligned defense. When operationalized correctly, each query supports measurable outcomes in both
- CIS Critical Security Controls and
- NIST Cybersecurity Framework.
This section shows exactly how.
🧭 The Big Picture: What These Queries Collectively Do
Together, these queries establish:
- Who is being targeted
- Who is doing the targeting
- How severe and persistent the activity is
- Whether it is escalating over time
- Whether payloads are transitioning from phish → malware
That aligns directly with Identify → Detect → Respond → Improve cycles in NIST, and Continuous Monitoring + Email & Web Protections in CIS.
📌 Query-by-Query Mapping & Operational Use
1️⃣ Top Targeted Recipients (Recipient + Sender Domain)
Use Case: “Which recipient + sender domain combinations represent the highest phishing pressure?”
Operational Value:
- Identifies specific attack paths, not just victims or domains in isolation
- Highlights campaign-level targeting patterns
- Drives fast containment decisions
CIS Mapping:
- CIS 8.7 – Email and Web Browser Protections Detects malicious email patterns and enables tuning of email security controls
- CIS 13.1 – Network Monitoring and Defense Analyzes inbound attack activity to identify malicious infrastructure
NIST CSF Mapping
- DE.AE-1 – Anomalous activity is detected and analyzed
- DE.AE-2 – Event data is aggregated and correlated from multiple sources
How to Operationalize
- Run weekly and alert on new sender-domain + recipient pairs
- Prioritize blocking decisions based on repeated pairings
- Use output to justify transport rules or domain suppression
2️⃣ Top Targeted Recipients (Recipient-Only Rollup)
Use Case: “Which users are being targeted the most overall?”
Operational Value
- Identifies human risk concentration
- Surfaces unexpected targets (often compromised or externally visible users)
- Guides protective control escalation
CIS Mapping
- CIS 6.3 – Access Control Management Prioritizes protection of accounts under active attack
- CIS 14.4 – Security Awareness & Skills Training Targets training where phishing exposure is highest
NIST CSF Mapping
- ID.RA-1 – Threats and vulnerabilities are identified
- PR.AA-1 – Identities and credentials are managed and protected
How to Operationalize
Escalate 🔴 / 🔥 recipients into:
- stricter phishing policies
- enhanced MFA / conditional access
- mailbox rule audits
Use results to justify VIP mailbox protections
3️⃣ Top Phishing Sender Domains (Domain-Only Rollup)
Use Case: “Which sender domains are responsible for the most phishing volume?”
Operational Value
- Identifies repeat offender infrastructure
- Enables campaign suppression at scale
- Provides defensible evidence for domain blocks
CIS Mapping
- CIS 8.7 – Email and Web Browser Protections Supports domain-based blocking and filtering
- CIS 15.1 – Service Provider Management Identifies external entities interacting maliciously with the organization
NIST CSF Mapping
- DE.CM-1 – Networks are monitored to detect potential cybersecurity events
- RS.MI-1 – Incidents are contained
How to Operationalize
- Alert when a domain crosses severity thresholds week-over-week
- Enrich with domain age and reputation
- Block aggressively once recurrence is established
4️⃣ Malware Email Daily Trend (Bonus Query)
Use Case: “When malware emails appear, who receives them, from where, and how often?”
Operational Value
- Detects payload escalation
- Identifies outbreak patterns
- Enables incident-grade timelines
CIS Mapping
- CIS 10.1 – Malware Defenses Detects and tracks malware delivery mechanisms
- CIS 8.8 – DNS Filtering / Web Controls Supports infrastructure-level mitigation
NIST CSF Mapping
- DE.AE-3 – Event data is analyzed to understand attack progression
- RS.AN-1 – Investigation and analysis are performed
How to Operationalize
- Alert on sudden day-over-day spikes
- Use as validation of email security effectiveness
- Attach results directly to incident reports
🧠 Closing Thoughts
With these mappings in place, you can now say — with confidence and evidence:
“Our email threat detection directly supports CIS v8 controls and NIST CSF detect-and-respond outcomes — and we can prove it with telemetry.” 📊✅
That’s the difference between: “We run some KQL queries” and “We operate a standards-aligned email defense program.”
By the end of KQL Toolbox #5, you’re no longer just counting blocked messages. You’ve built a practical hunting toolkit that delivers context, prioritization, and actionability across the two most common attack paths defenders face every day: phishing delivery and malware escalation. You know which users are being targeted, which domains are doing the targeting, and how those campaigns evolve over time.
And most importantly — these aren’t analytics toys; They’re the foundation of a proactive hunt cycle that turns raw email telemetry into defender decisions.
Here’s the uncomfortable truth every SOC eventually runs into: Blocking threats is only half the story. What really matters is what happens when users click — and what attackers try next. ⚠️
In KQL Toolbox #6, we follow the blast radius downstream — from junk clicks to identity actions and privilege changes. You’ll connect email telemetry to user behavior, directory changes, and PIM activity, closing the loop between detection, human risk, and identity control.
👉 Stay curious, stay aligned, and keep pushing your hunts closer to real-world impact. 😼🥷🛡️
📚 Want to go deeper?
From logs and scripts to judgment and evidence — the DevSecOpsDad Toolbox shows how to operate Microsoft security platforms defensibly, not just effectively.

🛠️ KQL Toolbox: Turning Logs into Decisions in Microsoft Sentinel

🧰 PowerShell Toolbox: Hands-On Automation for Auditing and Defense

📖 Ultimate Microsoft XDR for Full Spectrum Cyber Defense
Real-world detections, Sentinel, Defender XDR, and Entra ID — end to end.
🔗 Helpful Links & Resources
- 🔗 Query#1 — Top Blocked Phishing Events
- 🔗 Query#2 — Top Phishing Targets
- 🔗 Query#3 — Top Phishing Domains
- 🔗 Query#4 — Top Blocked Malware Events
⚡Other Fun Stuff…
- 🛠️ Kql Toolbox #1: Track & Price Your Microsoft Sentinel Ingest Costs
- 🛠️ Kql Toolbox #2: Find Your Noisiest Log Sources (with Cost 🤑)
- 🛠️ Kql Toolbox #3: Which Event Id Noises Up Your Logs (and Who’s Causing It)?
- 🛠️ Kql Toolbox #4: What Changed? Finding Log Sources With The Biggest Delta In Volume & Cost
- 🧰 Powershell Toolbox Part 1 Of 4: Azure Network Audit
- 🧰 Powershell Toolbox Part 2 Of 4: Azure Rbac Privileged Roles Audit
- 🧰 Powershell Toolbox Part 3 Of 4: Gpo Html Export Script — Snapshot Every Group Policy Object In One Pass
- 🧰 Powershell Toolbox Part 4 Of 4: Audit Your Scripts With Invoke Scriptanalyzer
- 😼 Legend of Defender Ninja Cat
