Welcome back to KQL Toolbox 👋
Last week in KQL Toolbox #5, we went full threat-hunter mode — tracking phishing and malware campaigns across domains, senders, and payload patterns.
But here’s the uncomfortable truth: Detection is only half the battle.
The other half is what happens after the message lands — when a human clicks, credentials get tested, sessions get established, and privileged access lights up.
So in this installment, we pivot from threat hunting → real-world risk outcomes, using KQL as our flashlight:
- Who’s clicking junk mail links? (human-risk telemetry)
- Who deleted an AD user? (identity tampering & destructive activity)
- Who’s activating privileged roles via PIM? (privilege oversight & audit proof)
- Who’s logging into domain controllers via RDP? (hands-on-keyboard evidence)
Each section includes:
✅ a line-by-line breakdown
✅ a regulatory mapping (NIST / CMMC / CIS)
✅ and steps to operationalize like a production SOC.
Let’s go build signals that actually hold up in investigations and audits. 🥷🐱
1️⃣ Who’s Clicking on Junk Mail?
let JunkedEmails = EmailEvents
| where DeliveryLocation == "Junk folder"
| distinct NetworkMessageId;
UrlClickEvents
| where NetworkMessageId in(JunkedEmails)
🔗 Who’s Clicking on Junk Mail? Query Available Here
🕵️ Line-by-line breakdown (what each piece is doing)
let JunkedEmails = EmailEvents
Creates a named variable called JunkedEmails.
EmailEvents is the Microsoft Defender for Office / email telemetry table that tracks delivery and classification outcomes.
✅ Why this matters: Using let makes the query modular, readable, and reusable — you’re building a “set” of message IDs you’ll pivot on.
| where DeliveryLocation == "Junk folder"
Filters the email dataset down to only messages delivered into the Junk folder.
✅ Why this matters: This is the “your filters worked… BUT” moment. These emails were already treated as suspicious/low-trust — yet people can still interact with them.
| distinct NetworkMessageId;
Extracts only unique message identifiers.
NetworkMessageId is the glue key that lets you correlate the same email across Defender tables (delivery, URL clicks, attachments, post-delivery actions, etc.).
✅ Why this matters: We’re building a clean list of “junk emails” we can match against user click activity.
UrlClickEvents
Switches to the table that records user clicks on URLs from messages.
This is where the rubber meets the road: user behavior.
| where NetworkMessageId in(JunkedEmails)
Filters click events down to only clicks that match the junk email message IDs you captured above.
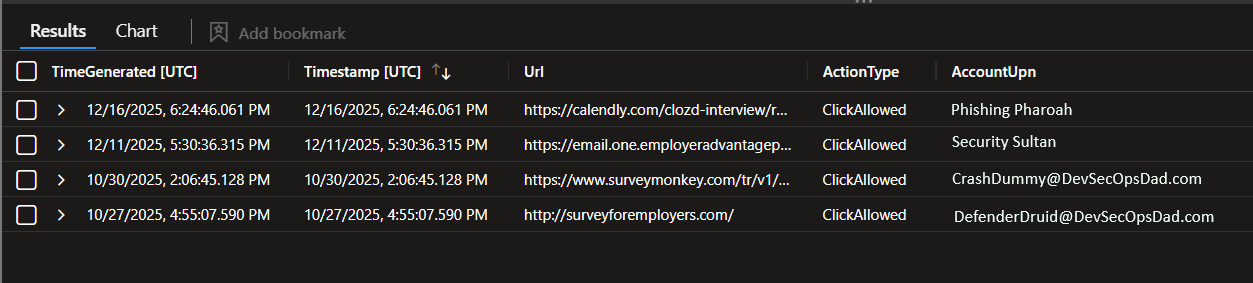
✅ What you get out of this query:
- “Which junked messages were clicked”
- And (depending on your tenant’s schema) usually:
- who clicked
- what URL
- when
- from which device/IP/browser
This is your “risky click” leaderboard. What it tells you (in plain English): Users are clicking links from emails that already landed in Junk. That’s a human-risk signal and a great leading indicator for phishing exposure.
🛡️ Regulatory & Framework Mapping
NIST 800-53
- AT-2 Awareness Training (target training based on actual risky actions)
- SI-4 System Monitoring (monitor suspicious user interaction)
- IR-4 Incident Handling (clicks can trigger investigation)
CMMC 2.0
- AT.L2-3.2.1 / AT.L2-3.2.2 (security awareness + role-based training)
- IR.L2-3.6.1 / IR.L2-3.6.2 (incident handling triggers)
- AU.L2-3.3.1 (audit evidence)
CIS v8
- Control 14 Security Awareness
- Control 9 Email & Browser Protections
- Control 8 Audit Log Management
⚔️ Steps to Operationalize
- Enrich it (add who/URL/time columns) and build a “Top Clickers” view.
- Set thresholds: e.g., 2+ junk clicks in 7 days = investigation / targeted training.
- Automate response:
- user notification
- password reset / token revoke if high-risk
- block URL/domain if repeated
- Measure improvement month-over-month (this is how you prove your awareness program works).
- Escalate when clicks tie to known bad domains or credential-harvest paths.

2️⃣ Who Deleted an AD User?
SecurityEvent
| where TimeGenerated > ago (90d)
| where EventID == "4726"
| extend Actor_ = Account
| project-reorder TimeGenerated, Activity, Actor_, TargetUserName, Computer
🔗 Who Deleted an AD User? KQL Query Available Here
🕵️ Line-by-line breakdown
SecurityEvent
Queries Windows Security Event Logs forwarded to Sentinel / Log Analytics.
This is where classic AD audit logging lives (account changes, group membership, logons, etc.).
| where TimeGenerated > ago (90d)
Limits results to the last 90 days.
Keeps costs/performance reasonable and focuses on relevant incidents.
✅ Pro tip: for alerting, you’ll tighten this to 1h/24h. For audits, 30–180 days is common.
| where EventID == "4726"
Filters to Event ID 4726: “A user account was deleted.”
✅ Why this matters: Deleting users is identity destruction. If attackers can’t keep persistence, sometimes they burn the house down on their way out.
| extend Actor_ = Account
Creates a new column Actor_ from the Account field (the actor who performed the deletion).
✅ Why this matters: explicit naming helps readability and makes it easier to join with other actor-based queries later.
| project-reorder TimeGenerated, Activity, Actor_, TargetUserName, Computer
Keeps only the most important columns and reorders them for analyst-friendly output.
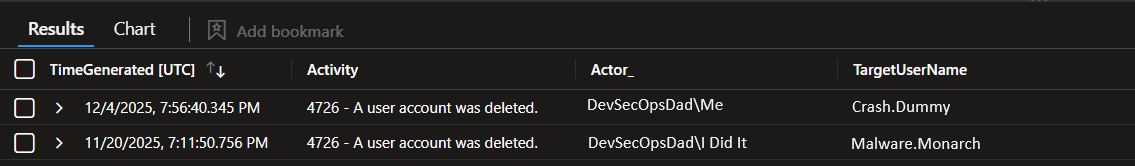
✅ What you get:
- When it happened
- What happened (Activity)
- Who did it (Actor_)
- Who got deleted (TargetUserName)
- Where it happened (Computer)
What it tells you: Which identities are being deleted, and who is doing it.
This supports:
- change control validation
- insider threat detection
- compromise investigation
- audit evidence
🛡️ Regulatory & Framework Mapping
NIST 800-53
- AC-2 Account management
- AU-2 / AU-3 / AU-6 audit event definition, content, and review
CMMC 2.0
- AC.L2-3.1.1 / AC.L2-3.1.2 access control enforcement
- AU.L2-3.3.1 / AU.L2-3.3.3 audit log review
CIS v8
- Control 5 Account Management
- Control 8 Audit Log Management
⚔️ Steps to Operationalize
- Alert in near-real-time (last 1h/24h) for account deletions.
Escalate immediately if:
- the deleted user was privileged
- deletion occurred outside approved change window
- actor is unusual/new
Correlate with:
- group membership changes (4732/4728)
- privilege activations (PIM)
- suspicious logons (4624/4625 patterns)
Create an audit report for IAM: deletions vs ticket approvals.
Harden: ensure only tightly controlled accounts can delete users.
3️⃣ Who’s Activating Roles via PIM?
AuditLogs
| where Category == "RoleManagement"
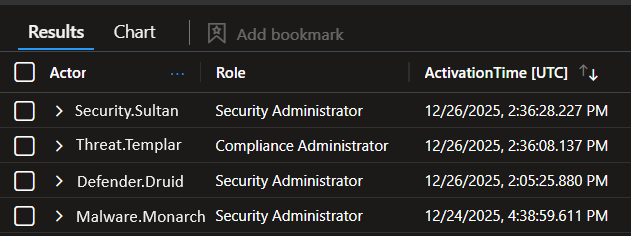
| where ActivityDisplayName == "Add member to role completed (PIM activation)"
| extend Actor = tostring(parse_json(InitiatedBy).user.displayName)
| extend IP = tostring(parse_json(InitiatedBy).user.ipAddress)
| extend Role = tostring(parse_json(TargetResources)[0].displayName)
| extend ActivationTime = TimeGenerated
| project Actor, Role, ActivationTime, IP
🔗 Who’s Activating PIM Roles? KQL Query Available Here
Line-by-line breakdown
AuditLogs
Queries Entra ID (Azure AD) audit logs ingested to Sentinel / Log Analytics. This is where identity governance actions show up: role changes, app consent, group changes, etc.
| where Category == "RoleManagement"
Narrows to role-related events.
✅ Why it matters: keeps your query clean and fast.
| where ActivityDisplayName == "Add member to role completed (PIM activation)"
Filters specifically to the audit event emitted when a user completes a PIM role activation.
✅ Translation: “Who elevated to admin… right now?”
| extend Actor = tostring(parse_json(InitiatedBy).user.displayName)
- Parses the JSON blob inside InitiatedBy.
- Extracts the initiating user’s display name.
✅ Why it matters: AuditLogs are nested JSON; parsing is how you get clean columns.
| extend IP = tostring(parse_json(InitiatedBy).user.ipAddress)
Pulls the initiator’s IP address.
✅ Why it matters:
- verify corporate vs external IP
- detect risky geo/IP anomalies
- correlate with suspicious sign-ins
| extend Role = tostring(parse_json(TargetResources)[0].displayName)
- Extracts the role that was activated (the “target resource”).
- Uses index [0] because TargetResources is an array.
✅ Why it matters: Now you can build a “Top Activated Roles” and baseline your privileged access patterns.
| extend ActivationTime = TimeGenerated
Makes the event time explicit and readable.
| project Actor, Role, ActivationTime, IP
Outputs exactly what an auditor and a SOC analyst both care about.
✅ “Who, what, when, where.”
What it tells you: Who is elevating privileges via PIM, what role they activated, and where they came from.
This is your strongest “least privilege is real” evidence.
🛡️ Regulatory & Framework Mapping
NIST 800-53
- AC-2 Account management (privileged assignment activity)
- AC-6 Least privilege (JIT elevation)
- AU-2 / AU-6 audit and review
CMMC 2.0
- AC.L2-3.1.5 least privilege
- AC.L2-3.1.6 privileged account management
- AU.L2-3.3.1 / AU.L2-3.3.3 auditing and review
CIS v8
- Control 6 Access Control Management
- Control 5 Account Management
⚔️ Steps to Operationalize
- Daily PIM activation digest to SOC + IAM.
- Baseline: normal roles, normal people, normal hours, normal IP ranges.
- Alert on anomalies:
- rare roles (Global Admin / Privileged Role Admin)
- activation outside business hours
- unfamiliar IP / risky sign-in correlation
- Correlate justification (ticket/approval) for audit defense.
Use it for access reviews: “Why is this role activated so often?”

Who’s RDP’ing into Domain Controllers?
If the last section was about identity lifecycle tampering (deletions), the next question is:
“Cool… but did anyone get hands-on-keyboard access to the domain?”
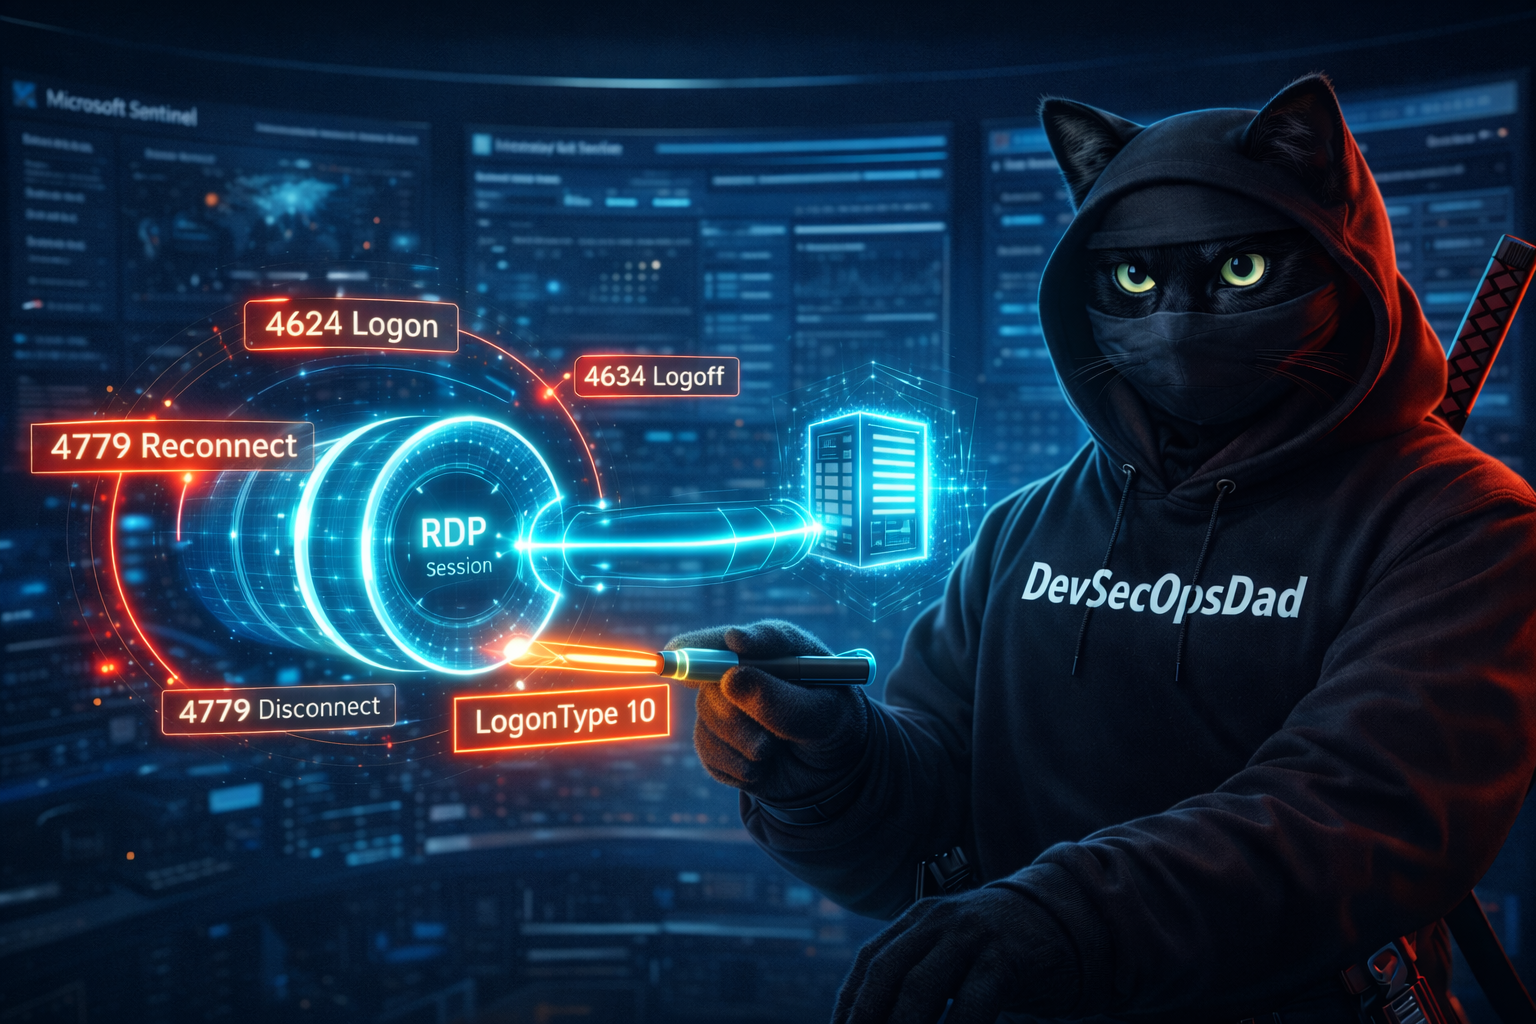
This query focuses on RDP session activity (logon/logoff/reconnect/disconnect) specifically in your domain controller security logs—giving you a fast way to confirm whether interactive admin access is happening, and who’s involved.
RDP Query A — Session activity timeline (quick triage view)
SecurityEvent
| where TimeGenerated > ago(30d)
| where EventID in (4624, 4634, 4778, 4779)
// Early filtering before parsing
| where AccountType != "Machine" // More efficient than string matching
| where Account !has "SYSTEM" and Account !endswith "$"
// Filter to RDP only for logons, keep all logoff/reconnect/disconnect
| where EventID != 4624 or LogonType == 10
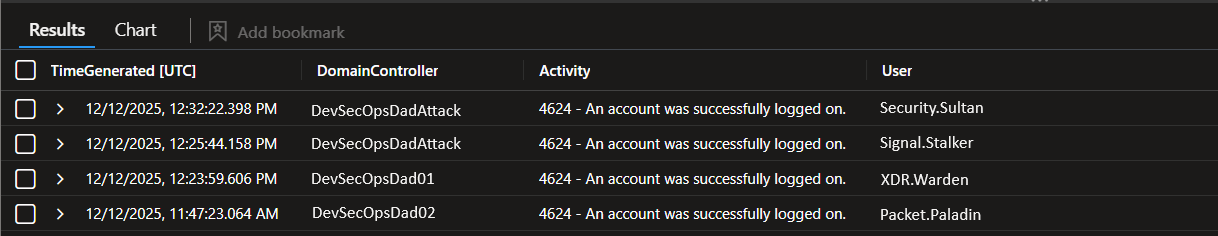
| project
TimeGenerated,
DomainController = Computer,
Activity,
User = coalesce(TargetUserName, Account)
| order by TimeGenerated desc
🔗 Who’s Logging In and When?.kql
Line-by-line breakdown
Pulls Windows Security logs (your “source of truth” for authentication + session events)…
| where TimeGenerated > ago(30d)
Limits the dataset to the last 30 days.
✅ Keeps it relevant and performant.
| where EventID in (4624, 4634, 4778, 4779)
You’re selecting the session lifecycle events:
- 4624 = Successful logon
- 4634 = Logoff
- 4778 = RDP session reconnected
- 4779 = RDP session disconnected
✅ This is what turns a single logon into a full session narrative.
| where AccountType != "Machine"
Drops machine accounts.
✅ Reduces “background noise” and keeps focus on human/operator behavior.
| where Account !has "SYSTEM" and Account !endswith "$"
More noise reduction:
- removes SYSTEM activity
- removes typical computer-account naming patterns ($)
✅ Makes your results more SOC-useful by default.
| where EventID != 4624 or LogonType == 10
This is the smart logic in the updated version.
If it’s a 4624 logon event → only keep it when LogonType == 10 (RDP)
If it’s a 4634/4778/4779 event → keep it, because those represent RDP session behavior (logoff/reconnect/disconnect)
✅ Result: you avoid non-RDP 4624 logons while preserving the RDP lifecycle events.
| project ...
Keeps output tight and analyst-friendly:
TimeGenerated— when it happenedDomainController = Computer— rename Computer for clarity in this contextActivity— readable description of the eventUser = coalesce(TargetUserName, Account)— selects the best available user field
✅ This makes it “drop into a workbook / incident note” clean.
| order by TimeGenerated desc
Newest events at the top (SOC-friendly default).
What Query A tells you
A time-ordered timeline of RDP session activity involving human accounts against your DCs (or whichever hosts are sending those SecurityEvents).
This is excellent for:
- quick incident triage
- “did anyone RDP in recently?” validation
- session-lifecycle context (connect/disconnect/reconnect patterns)
🛡️ Regulatory & Framework Mapping (for both RDP queries)
NIST 800-53
- AU-2 / AU-6: access/session events are auditable and must be reviewed
- AC-2 / AC-6: supports account management and least privilege oversight
- SI-4: monitoring for suspicious access patterns
CMMC 2.0
- AC.L2-3.1.1 / AC.L2-3.1.2: control/monitor access to systems
- AU.L2-3.3.1 / AU.L2-3.3.3: collect/review audit logs of access activity
- IR.L2-3.6.1 (supporting evidence): session visibility helps incident handling
CIS Controls v8
- Control 6: Access Control Management
- Control 8: Audit Log Management
- Control 13 (supporting): Network Monitoring & Defense (RDP is a high-value vector)
⚔️ Steps to Operationalize (RDP Query Version A)
- Use it as triage
- Run it during investigations to answer: “Who RDP’d into DCs recently?”
- Define what “should never happen”
- Many orgs decide: “Nobody should RDP to DCs directly.”
- If that’s your stance, this query becomes an instant detection source.
- Turn into alerts…
- Alert conditions might include:
- Any RDP logon to DCs by non-approved admin accounts
- Any RDP session outside maintenance windows
- Alert conditions might include:
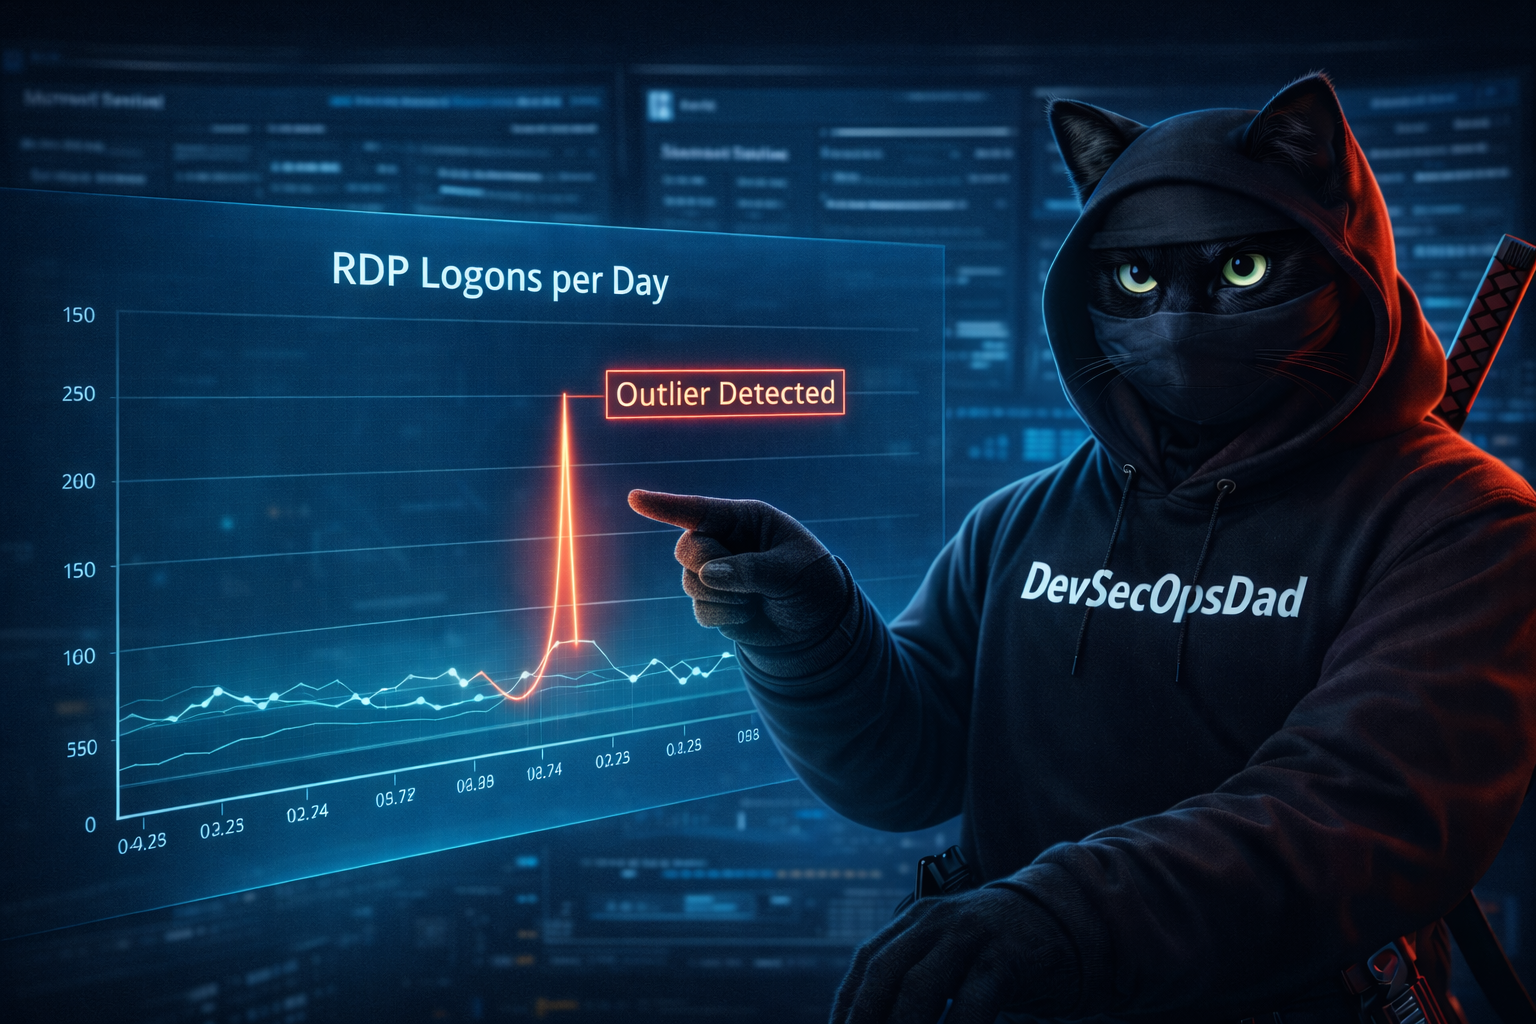
“Who’s the outlier?”
That’s why we pivot to the next query: it compresses 30 days of RDP logons into a timechart so abnormal spikes jump off the screen.
RDP Query B — Logon volume timechart (outlier detector)
SecurityEvent
| where TimeGenerated > ago(30d)
| where EventID == 4624  // Focus on successful logons only
| where AccountType != "Machine"
| where Account !has "SYSTEM" and Account !endswith "$"
| where LogonType == 10  // RDP only
| extend User = coalesce(TargetUserName, Account)
| summarize LoginCount = count() by
    Day = bin(TimeGenerated, 1d),
    User
| order by Day desc, LoginCount desc
| render timechart
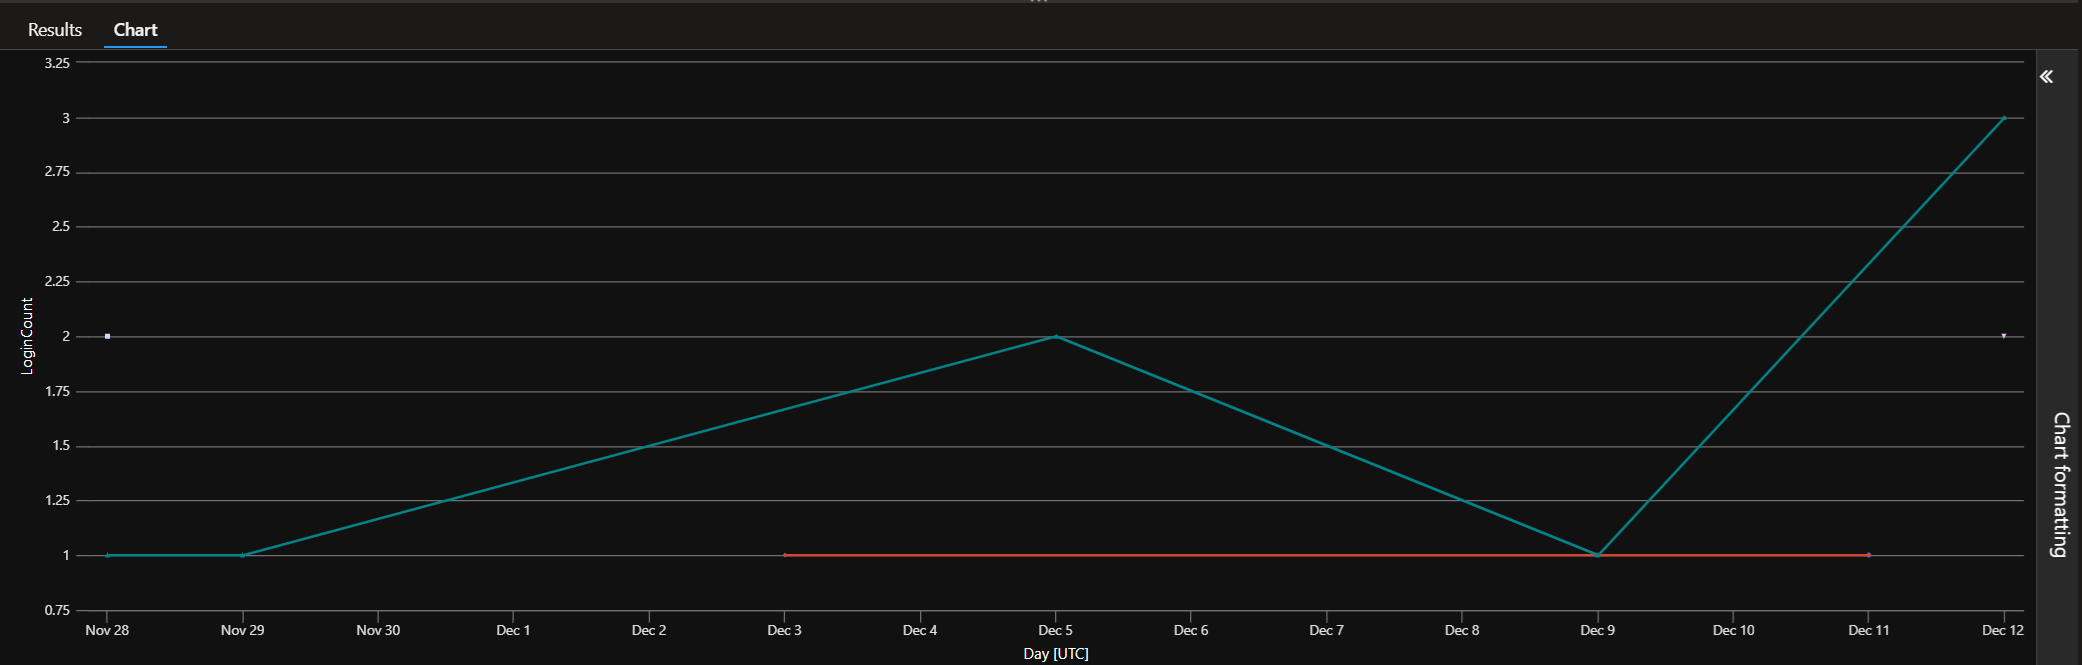
🔗 Who’s Logging In and When?.kql
Line-by-line breakdown (only what’s new vs Query A)
| where EventID == 4624
Unlike Query A (which includes session lifecycle events), this one focuses purely on successful logons.
✅ Why: It creates a consistent “countable” signal for trending.
| summarize LoginCount = count() by Day = bin(TimeGenerated, 1d), User
This is the magic.
bin(TimeGenerated, 1d) groups events into daily buckets
then counts how many RDP logons each user had per day
✅ Why it matters: this turns raw logs into a behavior metric you can baseline.
| render timechart
Instant visualization.
✅ Why it matters: it gives you a quick visual to identify outliers (your stated goal):
- “Why did this user have 70 RDP logons on Tuesday?”
- “Why did RDP activity spike across multiple users on the same day?”
⚔️ Steps to Operationalize (RDP Query Version B)
- Use this as the daily “RDP health chart”
- Add it to a workbook and check it as part of shift turnover.
- Baseline and detect spikes
- After 2–4 weeks, you’ll know what “normal” looks like.
- Anything above baseline becomes a review trigger.
- Create a follow-up drilldown workflow
- Click spike day/user → run Query A filtered to that user/day to get the session story.
- Alert on volume thresholds
- Example: “User exceeds X RDP logons/day” (tune per environment)
- Harden based on what you learn
- Move admin access to jump boxes only
- Reduce direct RDP pathways
- Require stronger controls around interactive admin behavior
🧠 Final Thoughts — Why These Signals Matter
KQL Toolbox #5 was about finding threats. KQL Toolbox #6 is about proving impact — and putting guardrails where attackers actually win:
- the moment a user clicks
- the moment an adversary attempts interactive access
- the moment identity is modified
- and the moment privilege is activated
These are the inflection points where incidents stop being theoretical and start becoming real.
If you only take one thing from this post, take this:
⚡ Your best detections don’t live in dashboards — they live in workflows.
So don’t just run these queries once and move on. Turn them into baselines, alerts, workbooks, and review cadences your SOC can execute every day — not just during incidents.
Because visibility without action is just noise. And once you’ve connected clicks → identity → privilege, the next question becomes unavoidable: Are your detections actually reducing response time — or just increasing coverage metrics? ⏱️📉
In KQL Toolbox #7, we step back and get brutally honest about outcomes — moving from MITRE coverage maps to MTTR reality. You’ll learn how to measure whether your detections are helping analysts respond faster, prioritize better, and close incidents sooner — not just check boxes.
Now go forth and make your logs behave. 🥷🐱🔥

📚 Want to go deeper?
From logs and scripts to judgment and evidence — the DevSecOpsDad Toolbox shows how to operate Microsoft security platforms defensibly, not just effectively.
🛠️ KQL Toolbox: Turning Logs into Decisions in Microsoft Sentinel
🧰 PowerShell Toolbox: Hands-On Automation for Auditing and Defense
📖 Ultimate Microsoft XDR for Full Spectrum Cyber Defense
Real-world detections, Sentinel, Defender XDR, and Entra ID — end to end.
🔗 Helpful Links & Resources
- 🔗 Who’s Clicking on Junk Mail?
- 🔗 Who Deleted an AD User?
- 🔗 Who’s Activating PIM Roles?
- 🔗 Who’s Logging In and When? RDP Queries A & B
⚡Other Fun Stuff…
- 🛠️ Kql Toolbox #1: Track & Price Your Microsoft Sentinel Ingest Costs
- 🛠️ Kql Toolbox #2: Find Your Noisiest Log Sources (with Cost 🤑)
- 🛠️ Kql Toolbox #3: Which Event Id Noises Up Your Logs (and Who’s Causing It)?
- 🛠️ Kql Toolbox #4: What Changed? Finding Log Sources With The Biggest Delta In Volume & Cost
- 🛠️ Kql Toolbox #5: Phishing & Malware Hunting
- 🧰 Powershell Toolbox Part 1 Of 4: Azure Network Audit
- 🧰 Powershell Toolbox Part 2 Of 4: Azure Rbac Privileged Roles Audit
- 🧰 Powershell Toolbox Part 3 Of 4: Gpo Html Export Script — Snapshot Every Group Policy Object In One Pass
- 🧰 Powershell Toolbox Part 4 Of 4: Audit Your Scripts With Invoke Scriptanalyzer
- 😼 Legend of Defender Ninja Cat
