
Welcome back to KQL Toolbox 👋
So now comes the unavoidable next question: Are our detections actually aligned to how attackers operate — and are we getting faster at shutting them down? This is where many SOCs stall out… They collect alerts, map techniques, and celebrate coverage — but never stop to ask whether all that visibility is translating into better response outcomes.
In this installment of KQL Toolbox, we zoom out just enough to connect the dots:
- MITRE ATT&CK tells us what adversary behaviors are showing up most often
- Mean Time to Resolution (MTTR) tells us whether the SOC can consistently respond fast enough when they do
Together, they form the bridge from detection coverage to operational effectiveness.
Because at the end of the day, the goal isn’t to say “we detect a lot of techniques.” The goal is to say “when these behaviors occur, we resolve them faster — with confidence and consistency.”
That’s the shift this post is about:
- from dashboards to discipline,
- from coverage maps to closed incidents,
- and from theoretical security to measurable defense.
Let’s get into it. 😼🥷🛡️
Query 1 — Most common MITRE tactics observed (Top 10 + pie chart)
SecurityAlert
| where TimeGenerated > ago(90d)
| where isnotempty(Tactics)
| mv-expand tactic = split(Tactics, ", ")
| summarize Count = count() by tostring(tactic)
| sort by Count desc
| top 10 by Count
| render piechart
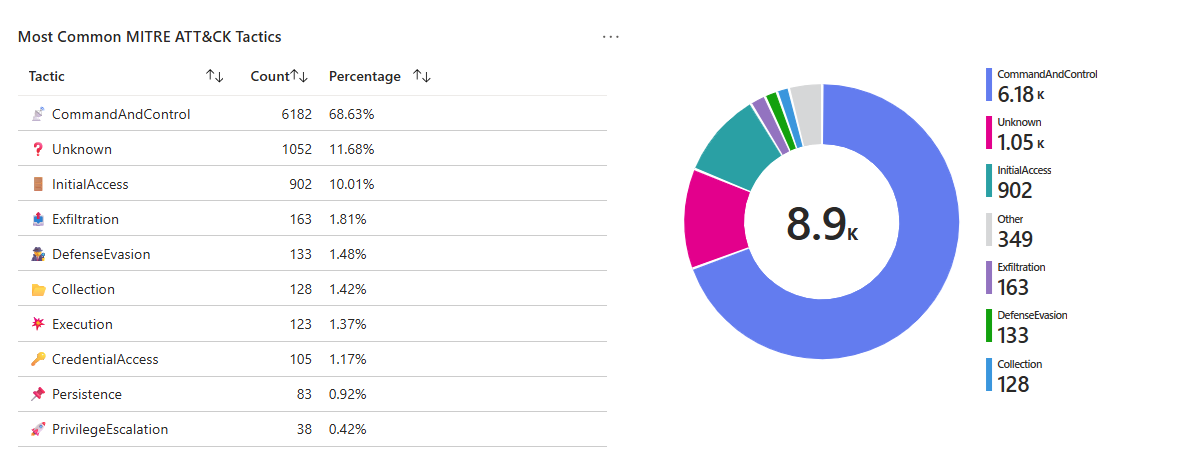
🤔 Why this is useful to a SOC
- Quick “threat posture snapshot”: Are you mostly dealing with Initial Access + Execution, or is Lateral Movement + Persistence dominating?
- Detection engineering priority: If a tactic is constantly showing up, it’s either (a) reality, (b) a detection bias, or (c) noise you need to tune.
- Executive translation: MITRE tactics are one of the fastest ways to communicate “what’s happening” without drowning in product-specific alerts.
🕵️ Line-by-line breakdown
SecurityAlert
Pulls alert records (Sentinel incidents/alerts depending on connector + normalization) where many products populate MITRE fields.
where TimeGenerated > ago(90d)
A 90-day window is usually long enough to smooth weekly weirdness and short enough to stay relevant.
where isnotempty(Tactics)
Ensures you only count alerts that actually have MITRE mapping (also acts like a “coverage check”).
mv-expand tactic = split(Tactics, ", ")
If the field is stored as a comma-separated list, this expands each tactic into its own row so you can count cleanly.
summarize Count = count() by tostring(tactic)
Counts occurrences per tactic.
top 10… + render piechart
Great for dashboards and “what are we fighting?” visuals.
🎚️ Tuning upgrades (high-impact)
1.) Normalize whitespace + casing (prevents “Persistence” vs “ Persistence” splitting counts)
| extend tactic = trim(" ", tostring(tactic))
| extend tactic = tostring(tolower(tactic))
2.) Slice by severity or product (answer “what’s driving this?”)
| summarize Count=count() by tostring(tactic), AlertSeverity, ProductName
3.) Filter out known noisy analytics rules (if one rule dominates your chart)
| where AlertName !in ("Rule A", "Rule B")
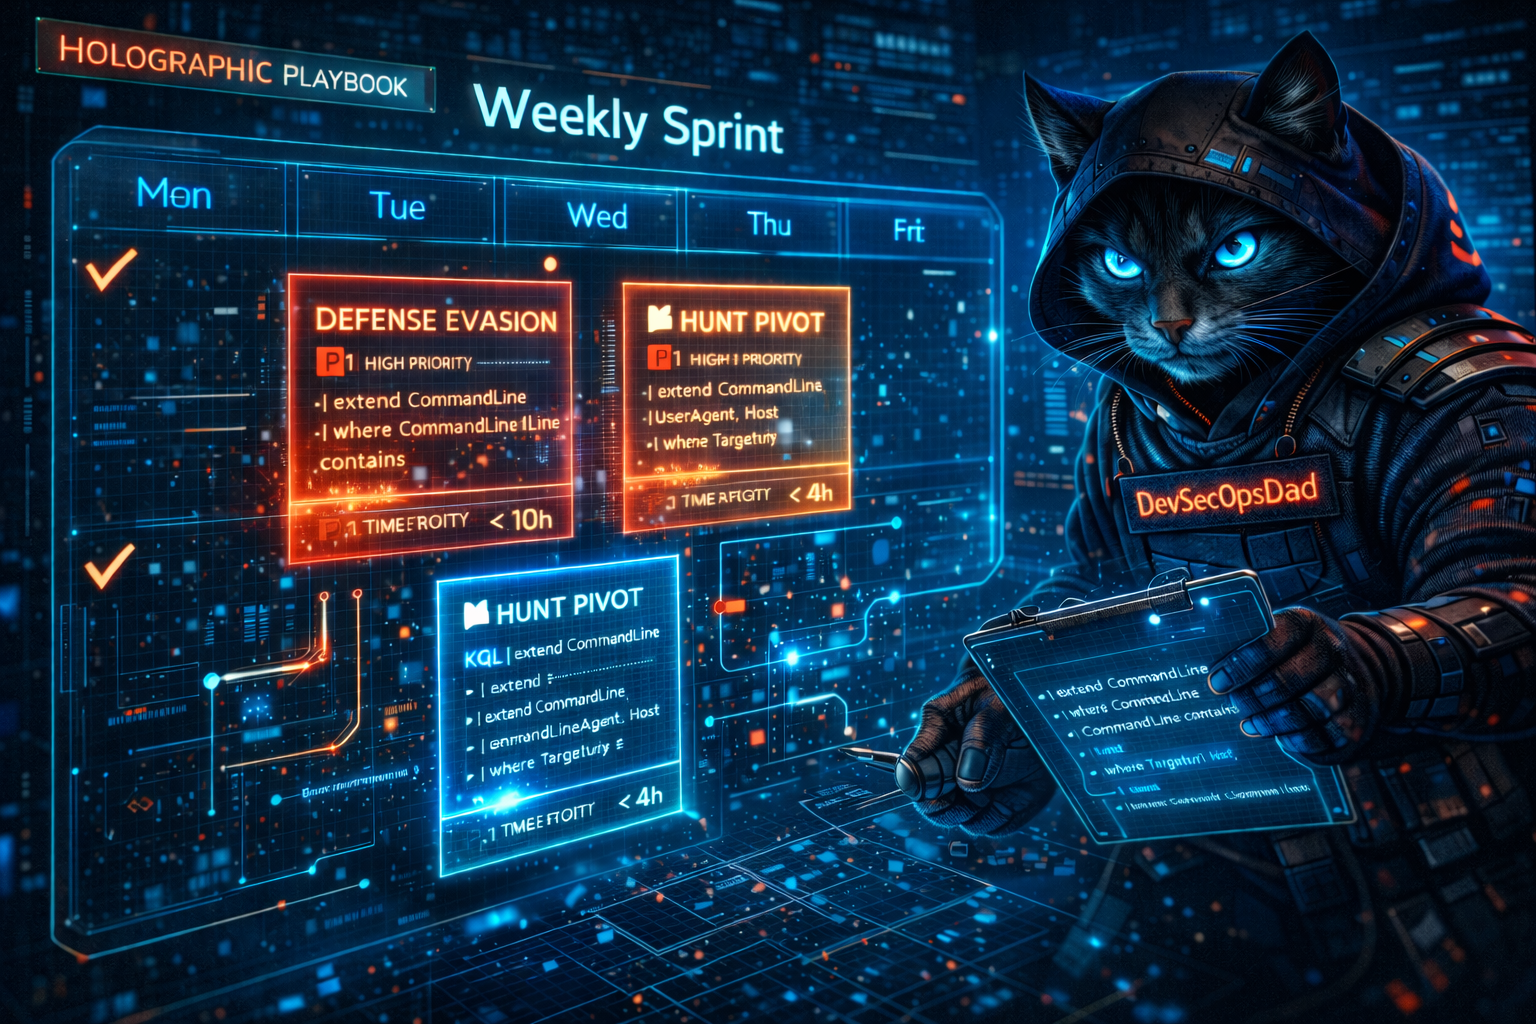
⚡ Operationalization playbook
- Weekly SOC review: “Top tactics” becomes a recurring agenda item.
- Detection backlog: If Defense Evasion is high, prioritize telemetry gaps + hardening detections there.
- Hunt pivot: Pick the #1 tactic and run a themed hunting sprint (one week = one tactic).

Query 2 — Most common MITRE techniques observed (Top 10)
SecurityAlert
| where TimeGenerated > ago(90d)
| where isnotempty(Techniques)
| mv-expand technique = split(Techniques, ", ")
| summarize Count = count() by tostring(technique)
| sort by Count desc
| top 10 by Count
| project ["MITRE Technique"] = technique, Count
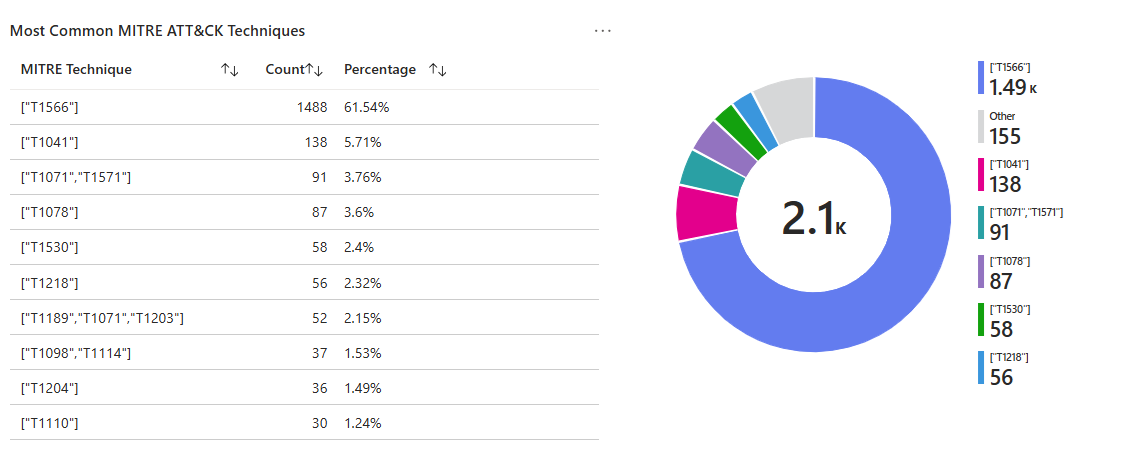
🤔 Why this is useful to a SOC
- Tactics tell you the phase of the attack. Techniques tell you the exact behavior (and often the exact telemetry you should be collecting).
- This query helps you:
- Measure real-world technique frequency (what’s actually firing)
- Spot coverage gaps (if tactics show up but technique mapping is sparse)
- Prioritize enrichment (technique-heavy detections should have playbooks + automation)
🕵️ Line-by-line breakdown
Same pattern as tactics, but at the technique level: where isnotempty(Techniques)
Useful as a coverage signal: if this returns very few results, you’re either missing mappings or your alert sources aren’t enriching.
mv-expand … split(Techniques, ", ")
Splits and expands technique list into rows
summarize Count
Counts each technique occurrence
project
Renames the column for clean dashboards/exports.
🎚️ Tuning upgrades (especially important here)
1.) Trim and standardize technique strings
| extend technique = trim(" ", tostring(technique))
2.) Break out Technique IDs vs Names
If your environment stores T1059 style IDs mixed with names, standardize them (or extract IDs if present) so counts don’t fragment.
3) Add a “who/where” pivot
Techniques are most valuable when you can immediately ask: which hosts, which users, which rule?
| summarize Count=count() by tostring(technique), AlertName, CompromisedEntity
| sort by Count desc
⚡ Operationalization playbook
Technique “Top 10” becomes your playbook roadmap: ensure top techniques have:
- enrichment (entity mapping),
- triage checklist,
- automation/containment actions,
- and detection tuning ownership.
Purple-team alignment: pick one technique and run an emulation test; validate alerts and measure time-to-close.

Query 3 — Median Time to Resolve (MTTR) by severity (Closed incidents)
// Get total MTTR
let TotalMTTRTable =
    SecurityIncident
    | where TimeGenerated > ago(90d)
    | where Status == "Closed"
    | summarize TotalMTTR = round(avg(datetime_diff('minute', ClosedTime, CreatedTime)), 2)
    | extend Key = 1;  // Adding a key for joining
// Calculate MTTR per severity
let SeverityMTTR =
    SecurityIncident
    | where TimeGenerated > ago(90d)
    | where Status == "Closed"
    | summarize MedianTTR = percentile(datetime_diff('minute', ClosedTime, CreatedTime), 50) by Severity
    | extend Key = 1;  // Adding a key for joining
// Join both results to calculate percentage
SeverityMTTR
| join kind=inner (TotalMTTRTable) on Key
| extend PercentageOfTotal = strcat(iff(TotalMTTR > 0, round((MedianTTR * 100.0) / TotalMTTR, 2), 0.0), '%')  // Ensure consistent data type
| extend MTTR_Severity = case(
                             MedianTTR <= 60,
                             '✅ Fast',
                             MedianTTR <= 180,
                             '⚠️ Medium',
                             '❌ Slow'
                         )
| project
    Severity,
    ["Median Time to Resolve (minutes)"] = MedianTTR,
    ["% of Total MTTR"] = PercentageOfTotal,
    ["MTTR Classification"] = MTTR_Severity
| order by Severity asc
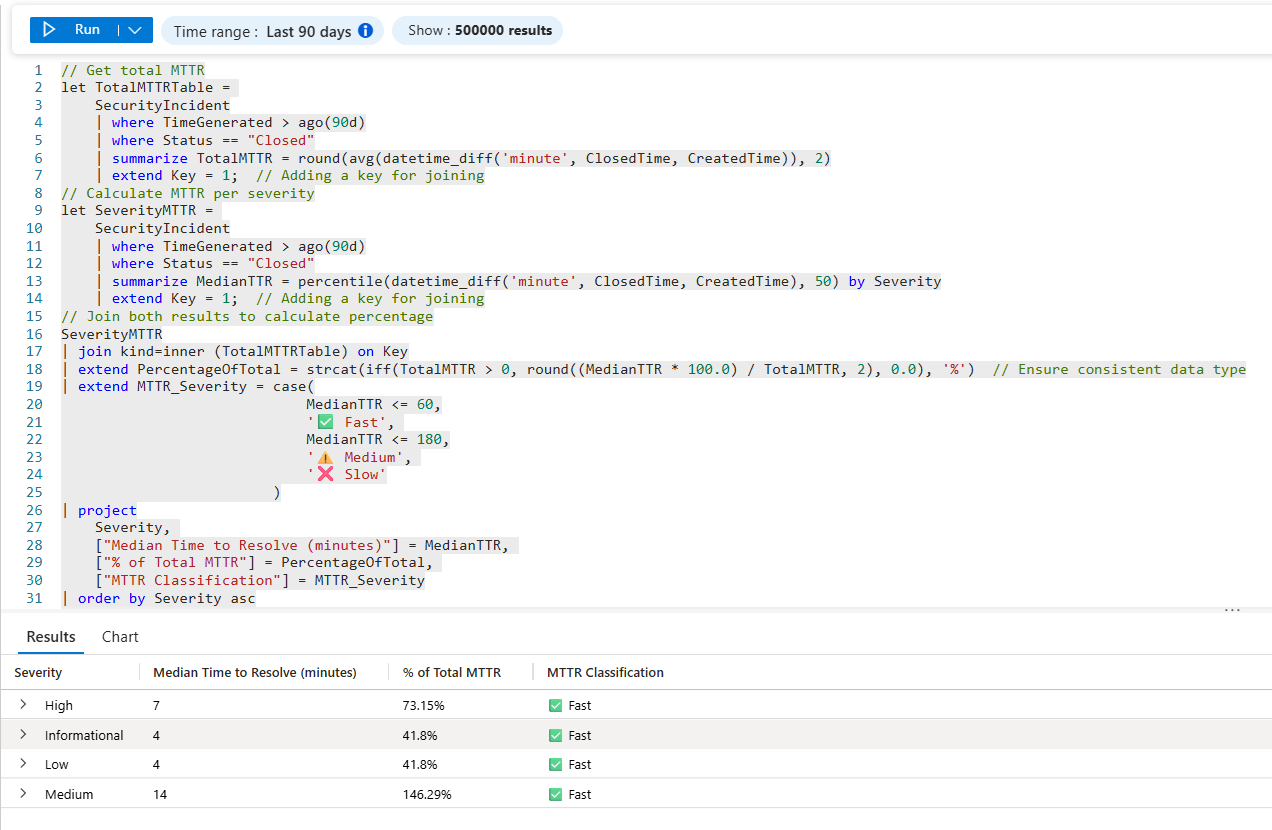
🤔 Why this is useful to a SOC
- This is the pivot from visibility to operational outcomes; Median time-to-resolve is more honest than average (a few “forever incidents” won’t skew it as hard).
- By severity shows whether your process matches your priorities.
It’s the beginning of true SOC performance measurement (and a great way to justify headcount, automation, tuning, and MSSP expectations).
🕵️ Line-by-line breakdown
✅ Block 1: Calculate your overall MTTR benchmark
// Get total MTTR
let TotalMTTRTable =
What it means: You’re creating a reusable “mini table” (a variable) named TotalMTTRTable that will hold your overall MTTR baseline.
SecurityIncident
What it means: Pulls from the SecurityIncident table (Microsoft Sentinel incidents).
| where TimeGenerated > ago(90d)
What it means: Limits analysis to the last 90 days so you’re measuring recent operational behavior, not ancient history.
| where Status == "Closed"
What it means: Only closed incidents count for MTTR (because we need a “start + finish”). Open incidents don’t have a real resolve time yet.
| summarize TotalMTTR = round(avg(datetime_diff('minute', ClosedTime, CreatedTime)), 2)
What it means:
datetime_diff('minute', ClosedTime, CreatedTime)= “minutes between created and closed”avg(...)= overall average resolution timeround(..., 2)= keep it neat for reporting
⚠️ Note: This is actually an average TTR baseline (not median). That’s fine—just know averages are more sensitive to outliers (one nasty incident can skew it).
| extend Key = 1; // Adding a key for joining
- What it means: Adds a constant Key column so you can join this 1-row table to another table later.
- Why it exists: KQL joins need a shared column—this is the “duct tape key.”
✅ Block 2: MTTR by severity (your “where it hurts” view)
// Calculate MTTR per severity
let SeverityMTTR =
What it means: Another variable table—this one will store resolve time by severity.
SecurityIncident
| where TimeGenerated > ago(90d)
| where Status == "Closed"
What it means: Same scope rules as your baseline so comparisons are apples-to-apples.
| summarize MedianTTR = percentile(datetime_diff('minute', ClosedTime, CreatedTime), 50) by Severity
What it means:
- Computes resolve minutes per incident
- Uses
percentile(..., 50)= median (the “typical” experience, less impacted by outliers) - Groups by Severity so you get one row per severity level
✅ Why median matters: Median tells you what most cases feel like. Average tells you what your worst days feel like.
| extend Key = 1; // Adding a key for joining
What it means: Same join trick—every severity row gets Key=1.
✅ Block 3: Join + compute “% of total MTTR” + classify speed
// Join both results to calculate percentage
SeverityMTTR
| join kind=inner (TotalMTTRTable) on Key
What it means: Adds the TotalMTTR baseline column onto every Severity row. Result: Each severity row now knows the “overall MTTR number” too.
| extend PercentageOfTotal = strcat(iff(TotalMTTR > 0, round((MedianTTR * 100.0) / TotalMTTR, 2), 0.0), '%') // Ensure consistent data type
What it means: Creates a percent value showing how big each severity’s median is relative to total average MTTR.
MedianTTR * 100.0 / TotalMTTR= percentiff(TotalMTTR > 0, ..., 0.0)prevents divide-by-zerostrcat(..., '%')turns it into a display-friendly string like 82.14%
⚠️ Reality check: This “% of total MTTR” is a relative indicator, not a true “contribution” metric (because you’re comparing median severity time to average overall time). Still useful as a quick “severity vs baseline” lens.
| extend MTTR_Severity = case(
                             MedianTTR <= 60,
                             '✅ Fast',
                             MedianTTR <= 180,
                             '⚠️ Medium',
                             '❌ Slow'
                         )
What it means: Operational classification:
- ≤ 60 min: ✅ Fast
- ≤ 180 min: ⚠️ Medium
- 180 min: ❌ Slow
Why it matters: This turns a metric into a decision signal—something you can throw into a dashboard and immediately spot where process / staffing / automation needs help.
| project
    Severity,
    ["Median Time to Resolve (minutes)"] = MedianTTR,
    ["% of Total MTTR"] = PercentageOfTotal,
    ["MTTR Classification"] = MTTR_Severity
What it means: Clean, report-ready output with friendly column names for workbooks / exec screenshots.
| order by Severity asc
What it means: Sorts results by severity label ascending.
✅ Tip: If your severities aren’t naturally ordered (e.g., “High/Medium/Low/Informational”), you might later add a custom sort key.

⚡ Operationalization playbook: Turning MTTR from a Metric into Muscle
This query is where metrics stop being vanity charts and start driving real operational change. Here’s how to wire it into your SOC so ❌ Slow doesn’t just sit there judging you.
📊 1. Workbook Placement (Make MTTR Impossible to Ignore)
Where this belongs:
- Microsoft Sentinel → Workbooks
- Create or extend a workbook called:
- “SOC Performance & Detection Reality”
- Or “MITRE Coverage → MTTR Reality” (chef’s kiss for execs)
Recommended layout:
- Top row — KPI tiles
- Overall MTTR (minutes)
- % of incidents classified ❌ Slow
- % change vs previous 30 / 90 days
- Middle — Severity MTTR table (this query)
- Severity
- Median Time to Resolve
- MTTR Classification (✅ / ⚠️ / ❌)
- Bottom — Trend chart
- Median MTTR by severity over time (weekly bins)
💡 DevSecOpsDad tip: Color-code the MTTR Classification column. Humans respond faster to color than numbers—just like alerts.
🚨 2. Alerting Thresholds (When “Slow” Becomes a Signal)
This query is not an alert by itself—but it feeds alerts beautifully.
Suggested alert conditions (starting point):
| Condition | Trigger |
|---|---|
| ❌ Slow incidents (High/Critical) | MedianTTR > 180 min |
| ⚠️ Medium trending worse | +20% MTTR increase week-over-week |
| SOC regression | Overall MTTR increases 2 periods in a row |
| Burnout indicator | Low severity MTTR creeping > 120 min |
How to implement:
- Wrap this query into a Scheduled Analytics Rule
- Evaluate daily or weekly (weekly is usually saner)
- Fire alerts to:
- SOC Manager channel
- Incident response lead
- ServiceNow / Jira (if you’re fancy)
🧠 Key mindset shift:
You’re not alerting on attacks—you’re alerting on operational failure.
🛠️ 3. Turning ❌ Slow into an Action List (The Part That Actually Matters)
A ❌ Slow classification is not a failure—it’s a diagnostic flag.
When a severity shows ❌ Slow, immediately pivot with these follow-ups:
🔍 A. Is it a detection problem?
Run:
- MITRE coverage queries
- Time-to-first-alert analysis
- Duplicate / noisy incident checks
Common finding:
- “We detected it… but 90 minutes too late.”
➡️ Action:
- Improve analytics rules, correlation logic, or data source coverage.
🧑🤝🧑 B. Is it an ownership problem?
Ask:
- Who was assigned?
- How long did assignment take?
- Was escalation manual?
➡️ Action:
- Auto-assign by severity
- Enforce SLA timers
- Add Logic Apps / automation rules
🔁 C. Is it a workflow problem?
Look for:
- Reopened incidents
- Excessive comments
- Long “waiting” gaps
➡️ Action:
- Create playbooks for top 5 slow scenarios
- Add decision trees to runbooks
- Remove approval bottlenecks
👥 D. Is it a people problem?
Yes, sometimes it is—and that’s okay.
➡️ Action:
- Targeted training (not generic)
- Shadow reviews on slow incidents
- Rotate analysts off burnout lanes
🎯 4. The Real Win: MTTR as a Feedback Loop
When operationalized correctly, this query becomes:
- A weekly SOC standup slide
- A monthly maturity metric
- A before/after proof point for leadership
- A budget justification engine (tools + headcount)
You’re no longer saying:
- “We have alerts.”
You’re saying:
- “We detect what matters, respond faster each quarter, and can prove it.”
That’s the jump from SOC activity to SOC performance.
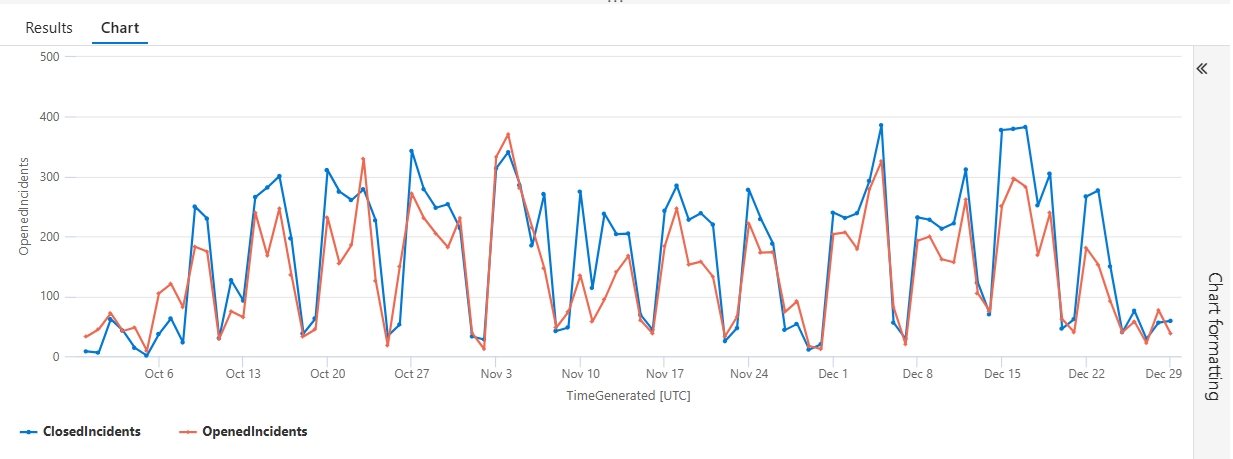
👉 Are we actually keeping up?
If “Opened” stays above “Closed,” you don’t have a SOC… you have a security debt factory.
What to look for:
- Healthy: Closed line meets or exceeds Opened most days (or catches up quickly after spikes).
- Unhealthy: Opened consistently above Closed → backlog growth.
- False confidence trap: MTTR improves but Opened outpaces Closed (you’re closing easy stuff fast while hard stuff piles up).
Turn “❌ Slow” into an action list
When the chart shows backlog growth:
- Pivot by Severity (is the backlog all Medium? Or are Highs stacking?)
- Pivot by MITRE tactic/technique (which behaviors are generating most incident volume?)
- Pivot by Product / Source (Defender for Endpoint vs Cloud Apps vs Identity — what’s feeding the beast?)
Fix the cause:
- Too many duplicates → tune analytics / suppression
- Too many benigns → tighten entity mapping + thresholds
- Too many “real” incidents → detection coverage is fine, response automation/playbooks aren’t
SecurityIncident
| summarize OpenedIncidents = countif(Status == "New"), ClosedIncidents = countif(Status == "Closed") by bin(TimeGenerated, 1d)
| render timechart
Line-by-Line Breakdown — Daily Incident Open vs Close Velocity
This query answers a deceptively simple but operationally critical question: Are we opening incidents faster than we’re closing them?
Let’s break it down line by line 👇
SecurityIncident
This is your source table in Microsoft Sentinel.
It contains one row per incident, including:
- Creation time
- Current status (New, Active, Closed)
- Severity
- Owner
- MITRE context (when mapped)
Everything that follows is scoped to incident lifecycle telemetry, not raw alerts.
| summarize
This summarize is where the math happens. Instead of inspecting individual incidents, we’re aggregating them to answer a trend question:
- How many incidents are opening vs closing over time?
OpenedIncidents = countif(Status == "New"),
This creates a calculated column called OpenedIncidents. countif() counts rows only when the condition is true. Here, we’re counting incidents whose Status is “New.”
💡 Why this matters: This represents incoming SOC workload — alerts that escalated into incidents and just landed on your team’s desk.
If this number spikes and stays high… your SOC is under pressure.
ClosedIncidents = countif(Status == "Closed")
This creates a second calculated column: ClosedIncidents; Same idea, different condition… Counts incidents that have reached a terminal state
💡 Why this matters: This is your throughput — proof that analysts are resolving, not just triaging.
A healthy SOC closes incidents at or above the rate they open.
by bin(TimeGenerated, 1d)
This is the time-bucketing logic.
bin(TimeGenerated, 1d) groups incidents into daily buckets and each row in the result represents one day.
💡 Why this matters: SOC performance is about trendlines, not point-in-time snapshots.
Daily granularity is perfect for:
- Shift analysis
- Week-over-week improvement
- Executive dashboards
| render timechart
This turns raw numbers into instant visual truth 📈
- X-axis: Time (by day)
- Y-axis: Count of incidents
Two lines:
- Opened incidents
- Closed incidents
💡 Why this matters: Executives don’t read tables — they read shapes.
This chart immediately shows:
- Backlog growth
- Burn-down efficiency
- Whether MTTR improvements are actually working
🎯 What This Query Really Tells You
At a glance, this chart answers:
- Are we keeping up with incident volume?
- Are process changes reducing backlog?
- Did a new detection rule overwhelm the SOC?
- Is MTTR improvement translating into closure velocity?
- This is where MITRE coverage meets operational reality.
🔧 Why This Belongs in KQL Toolbox
This query is a bridge metric:
- From detections → incidents
- From alerts → outcomes
- From “we have signals” → “we have control”
It pairs perfectly with:
- MTTR by severity
- MITRE tactic frequency
- Analyst workload distribution
🧩 Putting it together: “MITRE → MTTR” SOC storyline
- Tactics tell you the phase of enemy behavior you’re seeing most
- Techniques tell you the specific behaviors to harden detections/playbooks for
- Median TTR (MTTR) tells you whether the SOC can consistently close the loop fast enough
That’s a clean maturity arc: coverage → precision → performance.
🛡️ Framework mapping
NIST CSF 2.0
- DE.CM (Detect: Continuous Monitoring): tactics/techniques observed are direct signals of what detection content is producing and what behaviors are present.
- RS.AN / RS.MI (Respond: Analysis / Mitigation): MTTR measures the speed of analysis + containment/mitigation workflows.
- GV.ME (Govern: Measurement & Oversight): MTTR by severity is a real operational metric for governance/reporting.
CIS Controls v8
- Control 8 (Audit Log Management) & Control 13 (Network Monitoring and Defense): MITRE mapping is only as good as your logging + detection coverage.
- Control 17 (Incident Response Management): MTTR is a direct measure of IR operational effectiveness.
CMMC / NIST 800-171 (conceptual alignment)
- Incident handling and response performance expectations map naturally to measuring and improving time-to-resolve, especially when you can show severity-based prioritization.
🧠 Final Thoughts — The Bigger Picture
Over the course of this KQL Toolbox series, we didn’t just write queries — we built a repeatable SOC operating model.
- We started by making telemetry understandable and accountable: what you ingest, what it costs, what’s noisy, and what changed.
- Then we shifted from volume to risk, from threats delivered to human behavior, identity impact, and privilege control.
- And now, we’ve closed the loop by asking the only question that truly matters at scale: Is all of this making us faster and better at defending the environment?
By connecting adversary behavior (MITRE) to response outcomes (MTTR), you move beyond dashboards and coverage claims into something far more powerful — measurable operational maturity. You can explain not just what you see, but why it matters, what you prioritize, and how your SOC is improving over time.
That’s the difference between running KQL queries and running a defense program.
If there’s one takeaway from the entire KQL Toolbox series, it’s this: Logs are only potential energy. Discipline, workflows, and measurement are what turn them into results.
Now take these patterns, adapt them to your environment, and keep pushing your SOC up the maturity ladder — one intentional query at a time. 😼🥷🔎

📚 Want to go deeper?
From logs and scripts to judgment and evidence — the DevSecOpsDad Toolbox shows how to operate Microsoft security platforms defensibly, not just effectively.

🛠️ KQL Toolbox: Turning Logs into Decisions in Microsoft Sentinel

🧰 PowerShell Toolbox: Hands-On Automation for Auditing and Defense

📖 Ultimate Microsoft XDR for Full Spectrum Cyber Defense
Real-world detections, Sentinel, Defender XDR, and Entra ID — end to end.
🔗 Helpful Links & Resources
- 🔗 Who’s Clicking on Junk Mail?
- 🔗 Who Deleted an AD User?
- 🔗 Who’s Activating PIM Roles?
- 🔗 Who’s Logging In and When? RDP Queries A & B
⚡Other Fun Stuff…
- 🛠️ Kql Toolbox #1: Track & Price Your Microsoft Sentinel Ingest Costs
- 🛠️ Kql Toolbox #2: Find Your Noisiest Log Sources (with Cost 🤑)
- 🛠️ Kql Toolbox #3: Which Event Id Noises Up Your Logs (and Who’s Causing It)?
- 🛠️ Kql Toolbox #4: What Changed? Finding Log Sources With The Biggest Delta In Volume & Cost
- 🛠️ Kql Toolbox #5: Phishing & Malware Hunting
- 🧰 Powershell Toolbox Part 1 Of 4: Azure Network Audit
- 🧰 Powershell Toolbox Part 2 Of 4: Azure Rbac Privileged Roles Audit
- 🧰 Powershell Toolbox Part 3 Of 4: Gpo Html Export Script — Snapshot Every Group Policy Object In One Pass
- 🧰 Powershell Toolbox Part 4 Of 4: Audit Your Scripts With Invoke Scriptanalyzer
- 😼 Legend of Defender Ninja Cat
