 This week’s five briefs produced 20 KQL candidates across an Oracle PeopleSoft zero-day (CVE-2026-35273), evil MSI loaders, the VHDX-to-Remcos delivery chain, Dropping Elephant’s Fondue.exe side-loading, a Tor-speaking crypto clipper, the Mastra npm supply-chain compromise, an AI-agent RCE, and a pile of SSH brute force.
Most of those detections live on the endpoint. They watch one host’s process tree, one parent spawning one suspicious child. Good, necessary work.
But the detection that stuck with me this week wasn’t about a process tree at all. It was about an attacker who read your detection rules over your shoulder, understood exactly where your threshold sits, and built the entire attack to live one inch underneath it.
This week’s KQL of the Week is the coordinated SSH brute force story — and it’s really two queries, from Thursday’s and Friday’s briefs, that tell one campaign in two acts.
🥇 Act I: the attack that learned to spread out
Here’s the problem the winning query solves.
Every brute-force detection you’ve ever written has a number in it. A threshold. “Alert when one source IP fails authentication N times in M minutes.” It’s the most natural rule in the world:
Too many failures from one place = brute force
And for twenty years that worked, because brute force was one place hammering one door.
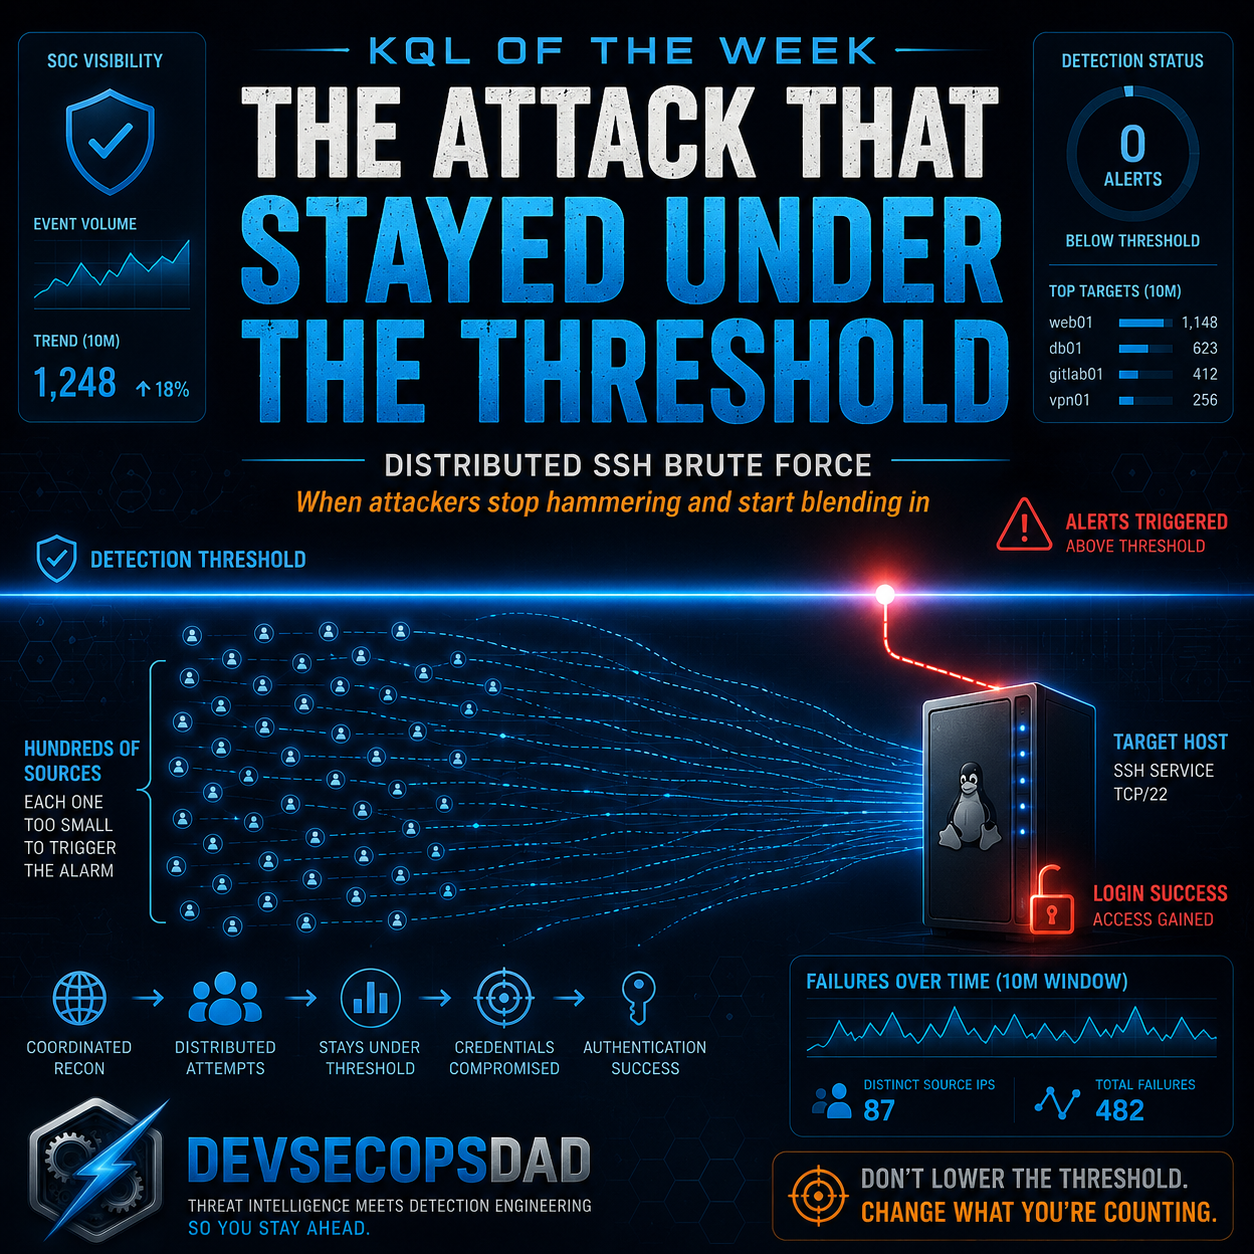
The SANS ISC guest diary behind this detection — three months of watching coordinated SSH campaigns — documents what happens when attackers grow up. They stop hammering. They distribute. A hundred source IPs, each one failing two or three times against the same host, none of them anywhere near your per-source threshold.
Your rule never fires.
Not because the attack got quieter. Because the attack got wider, and your rule was only ever looking at one axis: failures per source. The attacker simply moved the load onto an axis you weren’t counting.
Think of it as a bouncer who throws you out after you fail to show ID ten times. Reasonable policy. So the attacker doesn’t send one person ten times — they send a hundred people one time each. Nobody hits ten. The bouncer never moves. And the line keeps shuffling toward the door.
The KQL
let WindowMinutes = 10;
let DistinctIPThreshold = 10;
let FailedSSHSyslog = Syslog
| where (Facility == "auth" or SyslogMessage has "sshd")
| where SyslogMessage has_any ("Failed password", "Invalid user", "authentication failure")
| extend SourceIP = extract(@"from ([\d\.a-fA-F:]+)", 1, SyslogMessage)
| extend TargetUser = extract(@"(?:for|user) (\S+) from", 1, SyslogMessage)
| where isnotempty(SourceIP)
| project TimeGenerated, Computer, SourceIP, TargetUser, SyslogMessage;
FailedSSHSyslog
| summarize
    DistinctSourceIPs = dcount(SourceIP),
    TotalFailures = count(),
    SourceIPList = make_set(SourceIP, 20),
    SampleUsernames = make_set(TargetUser, 10)
    by Computer, bin(TimeGenerated, totimespan(strcat(tostring(WindowMinutes), "m")))
| where DistinctSourceIPs >= DistinctIPThreshold
| project TimeGenerated, Computer, DistinctSourceIPs, TotalFailures, SourceIPList, SampleUsernames
| order by DistinctSourceIPs desc, TimeGenerated desc
The line that does the work
It’s this one:
| summarize DistinctSourceIPs = dcount(SourceIP), ...
    by Computer, bin(TimeGenerated, totimespan(strcat(tostring(WindowMinutes), "m")))
Read what it’s grouping by. Not by SourceIP. by Computer.
That single change is the whole detection. The old rule asked “how many times did this IP fail?” This rule asks “how many different IPs failed against this host in the same ten minutes?” — and dcount(SourceIP) answers it.
You flipped the axis. You stopped counting knocks and started counting faces at the door. The distributed attack that was invisible per-source becomes loud per-target, because spreading across a hundred IPs is exactly the behavior dcount was built to light up.
That’s the reusable lesson, and it’s worth more than the query: the threshold you’re proud of is the threshold they’re built to evade. When an attack defeats your detection by spreading the load, don’t lower the threshold — change what you’re counting.
Keeping it honest
This query is a campaign-in-progress detector, not a compromise detector, and it has real edges:
- It never confirms anyone got in. Ten distinct IPs failing against a host is a storm, not a breach. High distinct-IP counts on an internet-facing box are also just… Tuesday. The brief is blunt about this: raise
DistinctIPThresholdto 25+ for exposed hosts, or you’ll alert on background radiation forever. dcountis approximate. It uses HyperLogLog, so it’s an estimate, not a true distinct count. At a threshold of 10 that’s fine. If you ever tune this to fire on small numbers, know that you’re trusting an estimator near its noisy edge.- Fixed bins split bursts.
bin(TimeGenerated, 10m)cuts time into hard ten-minute blocks. A campaign that straddles :09 to :11 gets cut in half — five IPs in one bin, five in the next — and neither half clears the threshold. Bin boundaries are where these detections quietly leak.
Act I tells you the storm is happening. It does not tell you whether the lightning hit anything. For that, you need Act II.
🥈 Act II: the login it was building toward
The same SANS reporting notes the part that should make you sit up: these distributed campaigns are followed by successful logins. The spray isn’t the goal. The spray is the cost of business. The goal is the moment one of those guesses lands.
Friday’s brief ships the detector for that moment, and it’s the query the first draft of this article crowned outright — for good reason. It’s the one I’d actually schedule first.
let lookback = 1h;
let failThreshold = 10;
let failedSSH =
    Syslog
    | where TimeGenerated > ago(lookback)
    | where Facility in ("auth", "authpriv") and SyslogMessage has "Failed password"
    | extend SourceIP = extract(@"from ([\d\.]+)", 1, SyslogMessage)
    | where isnotempty(SourceIP)
    | summarize
        FailCount = count(),
        FirstFail = min(TimeGenerated),
        LastFail = max(TimeGenerated)
        by SourceIP, Computer;
let successSSH =
    Syslog
    | where TimeGenerated > ago(lookback)
    | where Facility in ("auth", "authpriv") and SyslogMessage has "Accepted password"
    | extend SourceIP = extract(@"from ([\d\.]+)", 1, SyslogMessage)
    | extend User = extract(@"for (\S+) from", 1, SyslogMessage)
    | extend SSHPort = extract(@"port (\d+)", 1, SyslogMessage)
    | where isnotempty(SourceIP);
successSSH
| join kind=inner failedSSH on SourceIP, Computer
| where FailCount >= failThreshold
| where TimeGenerated > LastFail
| project
    TimeGenerated,
    Computer,
    SourceIP,
    User,
    SSHPort,
    FailCount,
    FirstFail,
    LastFail,
    AlertDetail = strcat("SSH success after ", tostring(FailCount), " failures from ", SourceIP)
The line that does the work
Long-time readers will recognize this one, because we just praised its cousin last week:
| where TimeGenerated > LastFail
That’s the line that turns a coincidence into a sequence. Without it, any successful login from a noisy IP matches that IP’s historical failures and you get garbage — successes that happened to share an address with old noise. With it, the query insists on order: the failures came first, the success came after. The story has a direction.
If that feels familiar, it should. Last week’s winner — the Azure logging-suppression sequence — leaned on the exact same primitive: enforce the time relationship with an explicit where after the join, never inside the on. Different telemetry, different table, same move. This is what it looks like when a primitive earns its keep across totally unrelated detections. The windowed, ordered join isn’t a trick. It’s a tool you reach for every week.
Event versus story
Consider the two alerts side by side.
Alert A:
SSH login succeeded for root from 203.0.113.40
A login. Could be your admin. Could be anyone. You have nothing.
Alert B:
198.51.100.7 failed 41 times against db-prod-02
between 02:14 and 02:51
then logged in successfully at 02:53 as svc_backup
Now you have a subject, a target, a timeline, and a verb. AlertDetail even hands the analyst that sentence pre-written. The raw events didn’t change. The context did — and context is the entire job.
Keeping it honest
Two queries from the same source, and they don’t actually agree on one important thing — so let’s say it out loud:
- Act II is IPv4-only. Look at the regex:
extract(@"from ([\d\.]+)", ...). Digits and dots. An attacker coming over IPv6 produces an emptySourceIPand gets dropped byisnotempty. Act I’s regex ([\d\.a-fA-F:]+) handles IPv6; Act II’s does not. If your exposed hosts answer on v6, your spray detector sees the attacker and your success detector goes blind at the worst possible moment. Fix the regex before you trust it. - NAT and shared egress lie to you. Failures and a success from one IP are only one story if one human owns that IP. Behind corporate NAT, a VPN concentrator, or carrier-grade NAT, the failures and the success can belong to two completely unrelated people. Treat shared egress carefully — but, as the brief notes, don’t dismiss it without checking.
- Ingestion timing can swallow the alert. Syslog doesn’t arrive in tidy order. If the
Accepted passwordevent indexes before the lastFailed passworddoes, the join misses and a fast attack slips through. This detection is most fragile against exactly the fast attacks you most want to catch.
The seam between the acts — and why you run both
Here’s the blind spot neither query owns alone, and it’s the reason this is one story instead of two.
Act I fires on distinct IPs per host and never needs a success. Act II fires on failures-then-success per IP with failThreshold = 10. Now picture the campaign that wins: a hundred IPs spray the host, and the IP that finally guesses correctly only failed six times before it landed.
Act II never fires. Six is below ten.
Act I did fire — it saw the storm — but Act I can’t tell you the lightning hit. So the winning login sails through the seam between a per-target storm detector and a per-source conversion detector. That’s not a bug in either query. It’s the architecture telling you something: distributed credential-access attacks have to be watched on both axes, because the attacker gets to choose which axis to hide on. Run Act I to catch the campaign. Run Act II to catch the conversion. Mind the gap between them, and tune failThreshold down on hosts where a successful guess matters more than alert volume.
🎖 Honorable Mention: when the AI agent becomes the exploit
If the SSH pair wins on operational value, Friday’s AutoGen Studio detection wins on where the puck is going.
Microsoft’s “AutoJack” research describes something genuinely new: a single malicious webpage that can reach an AI agent’s unauthenticated MCP WebSocket interface and turn the host running that agent into a remote-code-execution target. The browsing agent you deployed to read the web becomes the thing the web executes code through.
The detection watches an AutoGen Studio (or its Python host) process spawn the usual suspects:
let autogenProcesses = dynamic(["autogenstudio", "autogen_studio", "python.exe", "python", "python3"]);
let autogenCmdlineTerms = dynamic(["autogen", "autogenstudio", "mcp", "websocket"]);
let suspawnedProcs = dynamic([
    "cmd.exe", "powershell.exe", "pwsh.exe",
    "bash", "sh", "zsh",
    "curl", "wget", "certutil.exe", "bitsadmin.exe",
    "whoami.exe", "whoami", "net.exe", "net1.exe",
    "wscript.exe", "cscript.exe", "mshta.exe",
    "regsvr32.exe", "rundll32.exe"
]);
DeviceProcessEvents
| where Timestamp > ago(7d)
| where InitiatingProcessFileName in~ (autogenProcesses)
| where InitiatingProcessCommandLine has_any (autogenCmdlineTerms)
| where FileName in~ (suspawnedProcs)
| project
    Timestamp, DeviceId, DeviceName, AccountName,
    InitiatingProcessParentFileName, InitiatingProcessFileName,
    InitiatingProcessCommandLine, FileName, ProcessCommandLine, SHA256,
    AlertDetail = strcat("AutoGen process spawned ", FileName, " | Parent cmdline: ", InitiatingProcessCommandLine)
In plain English: “did my AI agent suddenly start acting like an attacker?”
The honest catch — and the brief flags it — is that this same shape is also what a legitimately useful agent looks like. Half the point of an agent is that it runs shell commands for you. So this is a hunt, not a scheduled rule, until you baseline what your agents normally spawn (the brief even hands you the baselining query). The signal isn’t “agent ran a shell.” It’s “agent ran a shell that doesn’t match anything it’s ever run before, right after talking to a webpage.”
Today that’s a niche detection for the handful of teams running agentic AI with shell access. Give it eighteen months. Process-spawn detection around AI workloads is going to be as routine as PowerShell logging is now — and the teams who started baselining early are the ones who’ll have a baseline when it matters. That’s why it earns the mention.
The bigger lesson
Three weeks, three different shapes of the same truth: the best detections this week weren’t the most complex KQL. They were the ones that asked a better question.
- Change what you count. When an attack beats your detection by spreading out, the answer usually isn’t a lower threshold — it’s a different
summarize. Count faces, not knocks. - Insist on sequence. A success next to old failures is a coincidence until
where TimeGenerated > LastFailmakes it a story. Order is signal. - Watch both axes, and name the seam. Per-source and per-target detectors cover for each other precisely because the attacker chooses which one to hide behind. Run both, and be honest about the gap where a low-and-slow winner slips through.
Every one of those came straight out of this week’s daily briefs — each detection shipped with ATT&CK mappings, telemetry requirements, triage runbooks, false-positive notes, and an honest readiness call. Twenty of them this week.
If you want this kind of detection content landing in your inbox every morning — fresh threat intel translated straight into deployable detections, so you spend your time tuning and shipping instead of reading and re-deriving — that’s the whole point of the Detection Engineering Brief at DevSecOpsDadAttack.com.
Stay Ahead of Emerging Threats
Looking for actionable threat intelligence and detection engineering insights?
DevSecOpsDadAttack publishes daily:
📈 Threat Intelligence Briefs focused on active campaigns, exploitation trends, and operational risk
🛠️ Detection Engineering Briefs with ATT&CK mappings, telemetry requirements, KQL detections, tuning guidance, and triage workflows
🔍 Practical analysis designed for SOC teams, threat hunters, detection engineers, and security leaders
Visit DevSecOpsDadAttack.com for the latest intelligence and detection content.

📚 Want to go deeper?
Anyone can aggregate threat intel. Very few teams can prove why they acted—or why they didn’t.
The below books are about closing that gap; turning curated signal into defensible decisions across KQL, PowerShell, and the Microsoft security stack.

🛠️ KQL Toolbox: Turning Logs into Decisions in Microsoft Sentinel

🧰 PowerShell Toolbox: Hands-On Automation for Auditing and Defense

📖 Ultimate Microsoft XDR for Full Spectrum Cyber Defense
Real-world detections, Sentinel, Defender XDR, and Entra ID — end to end.