
There is an HTTP endpoint somewhere in your estate that will hand a stranger every string your application has ever touched. Database passwords. JWT signing keys. Session tokens. The API key for the payment processor. It returns them in a single response, over TLS, with a 200, in about four seconds.
It is not a vulnerability. It is a feature, it is documented, Spring ships it, and your platform team probably turned it on during an incident in 2023 and never turned it back off.
Last week the attacker’s trick was that they brought no infrastructure — the C2 was a calendar, the encryptor was manage-bde.exe, every artifact belonged to you. This week they went one step further and brought no technique. There is no exploit here. There is no payload, no shellcode, no injection, no bypass. There is a GET request, and the response is the crown jewels. The adversary didn’t break in. They asked, and the application said yes.
That thread ran through nearly all seven of this week’s briefs and their 28 KQL candidates — 5 production, 10 hunting-only, 13 needing environment mapping — a Check Point SmartConsole auth bypass (CVE-2026-16232) carried over from last week and running Monday into Wednesday, AutoIT process injection into remote process memory, a TeamCity RCE (CVE-2026-63077) whose second detection was about credential files on disk, a vCenter directory-service authentication bypass (CVE-2026-59309) and its syslog directory traversal sibling (CVE-2026-59310), an SSH bot doing hardware reconnaissance before deploying a miner, OctLurk/SilkLurk running network scans while touching LSASS, the Rails Active Storage arbitrary file read the researchers called KindaRails2Shell (CVE-2026-66066), XCSSET writing into Xcode projects, and Midnight Blizzard signing in with credentials it already had.
Count the ones where the adversary’s core move was reading something they were technically permitted to read: the heapdump, the TeamCity credential files, the Rails file read, LSASS, the Xcode projects, the vCenter directory, the Midnight Blizzard sign-in. That’s most of the week.
But the one worth four thousand words is the Spring Boot heapdump, because it is the purest form of the problem and because all three of the briefs’ web-tier heapdump detections would have missed the traffic the source report actually documented. Not through bad engineering — through one string.
So this week’s KQL of the Week is heapdump exfiltration, in three queries and eleven corrections — five of theirs and six of mine. Act I hunts the request, from the web tier, and the fight there is over a number that most connectors don’t populate. Act II hunts the host, and turns out to be the stronger query, because Spring leaves a file behind whose name tells you an HTTP request happened even when your web logs don’t. The honorable mention stops hunting the attacker altogether and hunts your own exposure, which is the only finite population in this whole article.
🥇 Act I: The Response Is the Payload

Here’s the problem the winning query solves.
On July 27, SANS ISC published a diary on active scanning for Spring Boot heapdump endpoints. The mechanic is about as simple as intrusion gets. Spring Boot Actuator exposes a management endpoint that, when called, triggers a full JVM heap dump and streams it back as the HTTP response body. On HotSpot that’s an HPROF file; on OpenJ9 it’s PHD. Either way it is a byte-for-byte image of everything live in the process: every object, every field, every String — which in a real application means the contents of your HikariConfig, your OAuth client secrets, your signing keys, and every session token currently in flight.
The briefs picked it up Monday and Tuesday and produced four detection candidates from it: endpoint access from any source, successful retrieval by an external IP, external scanning, and heapdump file creation on the application host. Two of those are good ideas. The first three — the ones that read the web tier — share a single defect. The fourth reads the host instead, has a different defect entirely, and gets Act II to itself.
Every one of the three web-tier candidates hardcodes the literal path /actuator/heapdump.
Read the ISC diary again. The requests Johannes Ullrich actually captured were not to /actuator/heapdump. They were to /admin-api/actuator/heapdump, and the diary explains why: the management base path is configuration, set with management.endpoints.web.base-path, and moving it off the default is a normal — arguably recommended — thing to do. The attacker in that capture also sent Authorization: Basic YWRtaW46YWRtaW4=, which is admin:admin, because they assumed the endpoint would be behind authentication and just bet on the password.
So the detections derived from that report would not have fired on the traffic in that report. The source article contains the counterexample to the queries built from it, three paragraphs above where the queries got their idea. That is not a subtle failure and it is not a tuning problem — it is a string that was mistaken for a protocol.
Here is the distinction that fixes it, and it’s the whole detection. In Spring Boot, the base path is configurable and the endpoint ID is not. heapdump, env, configprops, beans, threaddump, mappings, loggers — those are the endpoint identifiers, and they appear as the final path segment regardless of where the management surface is mounted. management.endpoints.web.path-mapping.* can rename an individual endpoint, but almost nobody does, and the ones who do are not the ones with an exposed heapdump.
Match the endpoint. Never match the path.
The KQL
let lookback = 7d;
// Endpoint IDs are fixed by Spring. The BASE PATH is not -- the ISC capture shows
// /admin-api/actuator/heapdump, and management.endpoints.web.base-path can move it
// anywhere. Anything that hardcodes "/actuator/heapdump" is matching a default,
// not a protocol.
let ActuatorEndpoints = dynamic([
    "heapdump","env","configprops","beans","threaddump","mappings",
    "loggers","httpexchanges","httptrace","auditevents","jolokia","dump","trace"
]);
// Endpoints that leak secrets directly rather than structure. Used for RANKING,
// not for filtering -- a 200 on /beans is still an exposed management surface.
let SecretBearing   = dynamic(["heapdump","env","configprops","jolokia","dump"]);
// DERIVED from the endpoint list, not maintained beside it. The prefilter has to be a
// SUPERSET of the authoritative test or it narrows the detection silently -- and a
// hand-kept parallel copy drifts, which is exactly what mine did (see below). The
// "actuator" term is added as free breadth, not because the path is assumed to
// contain it. See the encoding caveat below.
let PrefilterTerms  = array_concat(ActuatorEndpoints, dynamic(["actuator"]));
// A ranking hint, NOT a gate. Nothing is discarded for being under it.
let ServedFloorBytes = 1048576;
_Im_WebSession(starttime=ago(lookback), url_has_any=PrefilterTerms)
// --- Path normalization. Decode FIRST: an encoded slash is a slash to the server
// and is not a slash to split(). Then strip scheme+authority (HTTPSession events
// carry them, WebServerSession events don't), then query, fragment, matrix params.
| extend UrlLower = tolower(url_decode(tostring(Url)))
| extend PathOnly = trim_start(@"[a-z][a-z0-9+.\-]*://[^/]*", UrlLower)
| extend PathOnly = tostring(split(PathOnly, "?")[0])
| extend PathOnly = tostring(split(PathOnly, "#")[0])
| extend PathOnly = tostring(split(PathOnly, ";")[0])
// Collapse //, then drop trailing slashes, so /actuator//heapdump/ and
// /actuator/heapdump are the same request -- because to Spring, they are.
| extend NormPath = trim_end(@"/+", replace_regex(PathOnly, @"/{2,}", "/"))
| extend Segments = split(NormPath, "/")
// THE authoritative test: exact equality against a parsed path SEGMENT, at ANY
// position. Not `Url has "heapdump"` -- that is a question about a term appearing
// somewhere, which is a different question and answers yes to /docs/heapdump-howto.html.
// And not the LAST segment either: /env, /loggers, /metrics and /health all take a path
// selector, and jolokia is mounted at /**, so on those the endpoint ID is never final.
| extend Matched = set_intersect(Segments, ActuatorEndpoints)
| where array_length(Matched) > 0
// Matched is almost always a single element. When it isn't (a selector that happens to
// equal another endpoint ID -- rare, e.g. /actuator/env/loggers), the element order of
// set_intersect is not documented, so Matched[0] is arbitrary rather than "the first in
// the path". `Matched` stays in the output so you can see when that happened.
| extend Endpoint    = tostring(Matched[0])
| extend EndpointIdx = array_index_of(Segments, Endpoint)
// Everything BEFORE the endpoint ID is the management base path, recovered from the
// data rather than assumed. Everything AFTER it is the selector, and the selector is
// evidence: /env/spring.datasource.password is a targeted secret read, /env is a sweep.
| extend BasePath = iff(EndpointIdx <= 0, "",
                        strcat_array(array_slice(Segments, 0, EndpointIdx - 1), "/"))
| extend Selector = strcat_array(array_slice(Segments, EndpointIdx + 1, -1), "/")
| extend TargetedSelector = isnotempty(Selector)
// --- Result. EventResultDetails is the HTTP status code; HttpStatusCode is an alias.
// EventOriginalResultDetails holds the source's raw value when normalization couldn't
// map it, so it's the better second look before falling back to anything coarser.
| extend StatusRaw  = coalesce(tostring(EventResultDetails),
                               tostring(column_ifexists("EventOriginalResultDetails","")))
| extend StatusCode = toint(extract(@"(\d{3})", 1, StatusRaw))
// THREE states again, and for a sharper reason than the size field. ASIM defines
// EventResult "Success" as status < 400 -- that is NOT evidence of a 200. A 302 to a
// login page is Success, and a 302 to a login page is the single most common response
// a PROPERLY PROTECTED actuator endpoint gives. Collapsing it into "answered" would
// launder the most important negative in this query into a positive.
| extend AnswerVerdict = case(
      StatusCode == 200,                   "Served",
      StatusCode between (300 .. 399),     "Redirected",
      StatusCode in (401, 403),            "AuthWall",
      StatusCode == 404,                   "NotPresent",
      isnotnull(StatusCode),               "OtherStatus",
      tostring(EventResult) =~ "Success",  "MaybeServed",   // sub-400, code unknown
                                           "NotServed")
| extend
    Served      = AnswerVerdict == "Served",
    MaybeServed = AnswerVerdict == "MaybeServed"
// --- Size. DstBytes is defined as bytes from the destination to the source, so on a
// web session it is the RESPONSE. HttpResponseBodyBytes is more precise and arrived in
// schema 0.2.7, so it may not exist in your parser at all -- column_ifexists, not
// coalesce, because coalesce on an absent column is a semantic error, not a null.
| extend RespBodyBytes = column_ifexists("HttpResponseBodyBytes", long(null))
| extend RespDstBytes  = column_ifexists("DstBytes", long(null))
// Resolve zero-as-null HERE, not only in the verdict below. coalesce() takes the first
// non-null value, so a parser that writes 0 into the PRECISE column shadows a real
// measurement sitting in the coarse one, and the more accurate field silently makes
// the answer worse. iff() on a null predicate returns the else branch, so an absent
// column and a zero both fall through to DstBytes.
| extend RespBytes = coalesce(iff(RespBodyBytes > 0, RespBodyBytes, long(null)),
                              RespDstBytes)
// Three states, not two. "No byte count" is NOT "small response" -- see the bonus.
| extend SizeVerdict = case(
      isnull(RespBytes),                "Unknown",
      RespBytes == 0,                   "Unknown",     // most parsers write 0 for absent
      RespBytes >= ServedFloorBytes,    "LargeBody",
                                        "SmallBody")
// Resolve optional columns ONCE, up here. column_ifexists() inside a summarize
// aggregate is asking a schema question in a place that should only see values.
| extend
    Client      = tostring(SrcIpAddr),
    ForwardedFor= tostring(column_ifexists("HttpRequestXff", "")),
    UserAgent   = tostring(column_ifexists("HttpUserAgent", "")),
    Service     = coalesce(tostring(column_ifexists("HttpHost","")),
                           tostring(column_ifexists("DstFQDN","")),
                           tostring(DstIpAddr)),
    Secretive   = Endpoint in (SecretBearing)
// Entity = the CLIENT. The service is an attribute here; it becomes the entity in the
// honorable mention, because "who took it" and "what of mine answers" are two questions.
| summarize
    Requests        = count(),
    ServedHits      = countif(Served),
    MaybeServedHits = countif(MaybeServed),
    SecretHits      = countif(Served and Secretive),
    SecretMaybeHits = countif(MaybeServed and Secretive),
    // A selector means the caller named a specific property, logger or MBean rather
    // than sweeping the endpoint. Ranked, not gated -- a bare /heapdump has no selector
    // and is still the worst row in this table.
    TargetedHits    = countif(TargetedSelector),
    // A sub-400 with an unknown code and a multi-megabyte body is served in
    // everything but the paperwork, so this counter spans both verdicts.
    LargeBodyHits   = countif((Served or MaybeServed) and SizeVerdict == "LargeBody"),
    UnknownSizeHits = countif(Served and SizeVerdict == "Unknown"),
    MaxRespBytes    = max(RespBytes),
    Endpoints       = make_set(Endpoint, 15),
    MultiMatchPaths = make_set_if(NormPath, array_length(Matched) > 1, 5),
    Services        = make_set(Service, 10),
    Paths           = make_set(NormPath, 10),
    BasePaths       = make_set_if(BasePath, isnotempty(BasePath), 10),
    Selectors       = make_set_if(Selector, isnotempty(Selector), 10),
    Statuses        = make_set(StatusRaw, 10),
    Verdicts        = make_set(AnswerVerdict, 8),
    UserAgents      = make_set(UserAgent, 5),
    Methods         = make_set(HttpRequestMethod, 5),
    Xff             = make_set_if(ForwardedFor, isnotempty(ForwardedFor), 5),
    Sources         = make_set(EventProduct, 5),
    ActiveDays      = dcount(bin(TimeGenerated, 1d)),
    FirstSeen       = min(TimeGenerated),
    LastSeen        = max(TimeGenerated)
    by Client
| extend
    DistinctEndpoints = array_length(Endpoints),
    Enumerating       = array_length(Endpoints) > 2,
    // ipv4_is_private() returns null for a v6 literal, so an unguarded call leaves a
    // v6 client as neither internal nor external. Default to "not internal" -- same
    // direction as the honorable mention, for the same reason.
    ProbablyInternal  = coalesce(ipv4_is_private(Client), false),
    MaxRespReadable   = format_bytes(coalesce(MaxRespBytes, long(0)))
// Ranking, in order of what actually changes your afternoon:
//   1. a secret-bearing endpoint returned a CONFIRMED 200
//   2. it answered with a body big enough to be a real dump
//   3. it answered and we CANNOT TELL how big -- an unknown outranks a small body
//   4. a secret-bearing endpoint answered sub-400 with no status code -- unverified,
//      and unverified belongs above "nothing", never above "confirmed"
//   5. breadth of enumeration
// Raw request volume is deliberately last. One successful GET is the whole incident;
// ten thousand 404s are Tuesday.
| order by SecretHits desc, LargeBodyHits desc, UnknownSizeHits desc,
           SecretMaybeHits desc, TargetedHits desc, DistinctEndpoints desc,
           ServedHits desc
The line that does the work
| extend Matched = set_intersect(Segments, ActuatorEndpoints)
| where array_length(Matched) > 0
Two lines, and they’re the difference between a detection and a decoration.
Note what this isn’t. It isn’t Url has "/actuator/heapdump", which is what all three web-tier brief candidates do in one spelling or another. That predicate asserts a full path, and a full path is a default value — the one thing about this endpoint that the operator of the application controls freely and that the attacker doesn’t need to touch. It also isn’t Url has "heapdump", which looks like the safe broadening but quietly changes the question: has tests whether a term appears anywhere in the value, so it returns true for /docs/heapdump-analysis.html, for a referrer, for a query string parameter named heapdump, and for a WAF rule name that got logged into the URL field. Presence is not position, and a detection that can’t tell the difference between “the client requested the heapdump endpoint” and “the string heapdump occurred in this record” will be tuned into silence within a week by an analyst who is, correctly, sick of it.
What the query does instead is parse the URL into segments and compare a segment for exact equality. That’s the same discipline as splitting a hostname into DNS labels rather than pattern-matching the dots: if your data is structured, compare it as structured data. /admin-api/actuator/heapdump contains the segment heapdump. So do /actuator/heapdump, /mgmt/heapdump, /internal/ops/actuator/heapdump, and whatever your platform team invented in 2023. All four match. /docs/heapdump-analysis.html doesn’t, because its segments are docs and heapdump-analysis.html, and equality knows that and has doesn’t.
The right test at the wrong position, which was mine
The first draft of this query did the segment comparison at a fixed index:
| extend Endpoint = tostring(Segments[array_length(Segments) - 1])
| where Endpoint in (ActuatorEndpoints)          // don't
Last segment, exact equality. It is correct for heapdump, which is why the article’s own example never caught it, and it is wrong for a good fraction of the endpoint list sitting three lines above it.
Several actuator endpoints take a path selector, and on those the endpoint ID is not the last segment and never will be:
| Request | Last segment | What it actually is |
|---|---|---|
/actuator/env/spring.datasource.password |
spring.datasource.password |
A targeted read of one secret |
/actuator/loggers/org.springframework |
org.springframework |
Logger config for one package |
/actuator/metrics/jvm.memory.used |
jvm.memory.used |
One metric |
/actuator/health/db |
db |
One health component |
/actuator/jolokia/read/java.lang:type=Memory |
java.lang:type=Memory |
An MBean read |
Read the Jolokia row twice. Jolokia is mounted at /actuator/jolokia/**, so every meaningful Jolokia request carries sub-path segments — and jolokia is on my SecretBearing list, which is to say I ranked it as one of the highest-value endpoints in the query and then wrote a test that could only ever match the bare, uninteresting form of it. The MBean invocation that turns an exposed Jolokia into remote code execution is exactly the request the fixed index throws away.
And /actuator/env/spring.datasource.password is worse than a miss, because it’s the sharpest signal in the whole family. A bare GET /actuator/env is a scanner sweeping. A GET for one named property is somebody who has already read the sweep and come back for the credential. The old query saw the first and was blind to the second.
So the fix is set_intersect() against the segment array — position-independent, still exact equality, still not has — and then array_index_of() to find where the match landed, which gives you two columns for free:
| extend Endpoint    = tostring(Matched[0])
| extend EndpointIdx = array_index_of(Segments, Endpoint)
| extend BasePath = iff(EndpointIdx <= 0, "",
                        strcat_array(array_slice(Segments, 0, EndpointIdx - 1), "/"))
| extend Selector = strcat_array(array_slice(Segments, EndpointIdx + 1, -1), "/")
BasePath is where your management surface actually lives, recovered from your own traffic rather than assumed — the thing this whole Act says you can’t hardcode, now produced as output instead of taken as input. Selector is what they asked for. Both go in the grid, neither gates anything.
The general form is uncomfortable and worth stating plainly: “compare a segment, not a string” is only half a rule. The other half is which segment, and a positional assumption is a hardcoded default wearing better clothes. I spent this section arguing that /actuator/heapdump is a default that shouldn’t be baked in, and baked in a different one four lines later.
The normalization above it is doing real work too, and each line is there because a real evasion exists for it:
url_decode()first, because%2factuator%2fheapdumpis a legitimate request to the server and an unparseable string tosplit(). Decode, then split — never the reverse. The cost of decoding first is that a legitimately encoded slash inside a segment gets over-split, which broadens the match. This is a positive selector, so breadth is free here; it would not be free in a suppression filter.- Collapsing
/{2,}and trimming trailing slashes, because//actuator//heapdump/reaches the same handler and is a different string. - Cutting at
;, because/actuator/heapdump;.jsis a path-parameter trick that survives a lot of naive WAF rules and reaches Spring intact.
And the second half of the section, which is the part I’d put on a wall.
Three states, because “I don’t know” is not “no”
Tuesday’s Detection 3 is the best idea in the briefs this week. It is trying to separate a scan from a breach by asking whether the response was large enough to have been a real heap dump. That is exactly right — the request tells you nothing, since the internet requests this path continuously and always will; the answer is the incident. Here is the query it shipped:
| where EventOutcome startswith "200"
| where isnotempty(BytesReceived)
| where tolong(BytesReceived) > 1048576
Three lines, four problems, and they fail in three different directions.
BytesReceived is not a column in CommonSecurityLog. The columns are ReceivedBytes and SentBytes, mapped from the CEF in and out keys respectively. The brief’s own caveat says that if the connector doesn’t populate the field, tolong(BytesReceived) evaluates to null and the filter silently drops all rows. That’s the wrong failure mode for the right field: a reference to a column that doesn’t exist in the schema isn’t a null, it’s a semantic error, and the query doesn’t return zero rows — it doesn’t run. Which is, honestly, the lucky outcome. A query that won’t compile gets fixed on the day someone tries it. Everything else in this list gets discovered a quarter later.
Even spelled correctly, the direction is a coin flip. Microsoft documents in → ReceivedBytes as “number of bytes transferred inbound” and out → SentBytes as “number of bytes transferred outbound”. Inbound and outbound relative to what is not specified, because it can’t be — it depends on whether the reporting device considers the client or the server to be the source, which varies by vendor and sometimes by log type within one vendor. For a GET request the two numbers are wildly asymmetric: the request is a few hundred bytes and the response is a few hundred megabytes. Pick the wrong one and your “was it served” gate is reading the size of the request, which is small for a successful theft and small for a blocked scan and therefore tells you nothing at all. There is no way to resolve this from the schema. You resolve it by downloading something large through the device and reading which column moved.
EventOutcome is documented as success or failure, not as an HTTP status code. Some CEF sources do put the status code there; plenty write a word, and some write 200 OK. startswith "200" handles the last case and fails the first, and also matches 2000 and 200000 if a source ever writes a byte count into an outcome field, which is the kind of thing that happens exactly once and takes a day to find.
And isnotempty() deletes the finding. This is the one that matters, and it survives every other fix in this list.
Walk the logic. isnotempty(BytesReceived) discards every record where the connector didn’t emit a byte count. In an environment where the connector emits byte counts, that clause does nothing. In an environment where it doesn’t, that clause discards the entire population, and the query returns clean. So the filter is a no-op in the environments that don’t need it and a total blackout in the environments that do. It cannot help. It can only hide.
And the reasoning behind it is the interesting part, because it’s the reasoning everybody uses. The engineer wrote isnotempty() to be careful — to avoid comparing against a null. But look at what the guard actually encodes. A missing byte count means we do not know whether the heap dump was served. And on this endpoint, “we don’t know whether the crown jewels left the building” is not a low-signal event to be filtered away. It is the second-highest-priority row in the result set, behind only a confirmed large response, and ahead of every confirmed small one.
Two states — matched, not matched — cannot express that. So the query above uses three:
| extend SizeVerdict = case(
      isnull(RespBytes),             "Unknown",
      RespBytes == 0,                "Unknown",
      RespBytes >= ServedFloorBytes, "LargeBody",
                                     "SmallBody")
and then ranks LargeBodyHits, then UnknownSizeHits, then everything else. Nothing is discarded for being unmeasurable. The unmeasurable rows are promoted, and the analyst is told which ones they are, which means the first time this rule fires in an environment with no byte counts, someone finds out that the environment has no byte counts. That is a better outcome than a clean dashboard.
The RespBytes == 0 line is a judgement call and I want it visible rather than buried. My reading is that most parsers write 0 rather than null when the source didn’t report a size, which makes treating a literal zero as “unknown” the safer default — but that is a generalization about parser behaviour, not something the schema promises, and it is the single assumption in this query I’d most want you to check rather than inherit. There’s a validation query for it in Keeping it honest below. The cost of being wrong in my direction is that you can’t detect a genuinely empty response body, which nobody needs. The cost of being wrong in the other direction is that every unmeasured response gets filed as SmallBody and ranks last, which is the whole failure this section exists to argue against.
The floor itself — 1 MiB — is fine, and it’s fine for a reason worth naming, because thresholds in this article are otherwise treated as suspect. It is not separating “big” from “small” traffic in some baselined sense. It’s separating a heap dump from an error page. A JVM heap for a real Spring application starts in the tens of megabytes and routinely runs into the hundreds; a 404, a WAF block page, a JSON error body, and a redirect are all under 100 KB. There is roughly three orders of magnitude of empty space between those two populations, and a threshold placed in the middle of a three-order-of-magnitude gap is not a tuning parameter, it’s a type check. The threshold you should be suspicious of is the one placed inside a distribution, not the one placed in a hole.
The same mistake, three lines higher, and it was mine
Everything above is about the byte count. The status code needed the identical treatment and my first draft of this query didn’t give it to it, which is worth putting on the page rather than quietly fixing, because it is the exact failure this section spends a thousand words condemning.
What I originally shipped was this:
| extend Answered = (StatusCode == 200)
             or (isnull(StatusCode) and tostring(EventResult) =~ "Success")
The intent was reasonable — when a parser doesn’t populate a numeric status, fall back to the normalized result. The problem is what ASIM’s EventResult actually means. Success is defined as any status below 400, not as 200. So the fallback quietly admits 201, 204, 206, 301, 302, and 304 into a column named Answered, and then the rest of the query treats them as evidence that a heap dump was served.
Now think about which of those you’d actually see on this endpoint. It isn’t 206. It’s 302 to a login page — which is precisely what a correctly protected actuator surface returns, and precisely the population the honorable mention has a dedicated Protected bucket for. My fallback took the strongest negative signal available and filed it as a positive. In the exposure inventory that becomes P1 - secrets, externally reachable printed next to a service that is configured exactly right, and a P1 list with false emergencies at the top is a list nobody reads twice.
So Answered is gone, replaced by AnswerVerdict with seven named outcomes and a MaybeServed state that means what it says: the source told us this was sub-400 and did not tell us which sub-400. It ranks below every confirmed 200 and above nothing at all, it never becomes a P1 on its own, and it gets promoted only when the body size corroborates it — because a 302 carries a few hundred bytes and a heap dump carries hundreds of megabytes, and that gap does the work the missing status code couldn’t.
The general form, which is the same sentence as the size argument with a different noun: a coarse field is not a fallback for a precise one. EventResult and EventResultDetails do not answer the same question, and substituting one for the other when the precise one is missing isn’t graceful degradation — it’s answering a question you weren’t asked and reporting it as though you were.
A KQL note: column_ifexists() and the difference between absent and empty
Act I references three columns that may not exist in your workspace at all — HttpResponseBodyBytes (added in Web Session schema 0.2.7 and Optional even there), HttpRequestXff, and HttpUserAgent. That is a different problem from a column that exists and is null, and it needs a different tool.
// Wrong: if the column is absent, this is a semantic error and the query won't run.
| extend RespBytes = coalesce(HttpResponseBodyBytes, DstBytes)

// Right: resolve the column reference at query time, with a typed default.
| extend RespBytes = coalesce(
             column_ifexists("HttpResponseBodyBytes", long(null)),
             column_ifexists("DstBytes", long(null)))
coalesce() handles values. column_ifexists() handles schemas. They are not interchangeable and the failure modes are opposite: a value problem gives you a wrong answer, a schema problem gives you no answer. Note the typed default — long(null) and not 0, and not "". A default of 0 would turn “this schema has no byte counts” into “every response was zero bytes long”, which is the isnotempty() mistake wearing a different hat: an unknown laundered into a measurement. Type it to match the column you’re substituting for, and let it stay null so that the case above can see it.
A fair question, since these queries reference plenty of columns without the wrapper: what’s the rule? Mine is that column_ifexists() goes on anything I can’t guarantee is in every parser’s projection — fields marked Optional, fields added in a specific schema version, and anything a source-specific parser might reasonably decline to emit. Mandatory schema core — Url, SrcIpAddr, DstIpAddr, EventResult, TimeGenerated — gets referenced bare. That line is a judgement, not a rule Microsoft publishes, and you may draw it somewhere else. Draw it somewhere, and be consistent about it, because the alternative is a query where the presence of a wrapper tells the next reader nothing about whether the column is actually at risk. Where I’ve wrapped something your parser guarantees, the wrapper costs a few characters. Where I’ve left something bare that your parser drops, you get a semantic error on day one instead of a wrong answer in month three — which is the failure I’d pick if I had to pick.
This matters beyond ASIM. Any query that has to run across multiple workspaces, or across a connector migration, or against a table Microsoft is still adding columns to, is a query that should be reaching for column_ifexists() rather than assuming.
Keeping it honest
The briefs filed all three web-tier candidates as requires environment mapping, and that’s the correct call — for a reason none of them names, which is that the mapping isn’t optional, it’s the detection.
_Im_WebSessionreturns nothing at all if you have no Web Session parsers deployed, and it returns it silently. The unifying ASIM parsers are a union over the source-specific parsers you’ve actually enabled. Zero enabled parsers is a valid, empty union. Run this before anything else:_Im_WebSession(starttime=ago(1d)) | summarize Events = count() by EventVendor, EventProduct, EventType | order by Events desc. If that comes back empty, you have a parser deployment task, not a detection task — and finding that out in ninety seconds is worth more than the rest of this section.EventTypechanges what the other fields mean.HTTPSessionevents come from a proxy or web gateway that terminated the client connection: they carry full URLs with scheme and host, and they usually carry byte counts.WebServerSessionandApiRequestevents come from the server or application itself: the docs are explicit that these “typically have less network related information”, the URL is path-and-parameters only, andDstBytesis frequently absent. So the same detection has different reliability depending on which side of the connection logged it, and a workspace fed only by app servers will run entirely in theUnknownsize lane. That’s not a bug, and it’s exactly why the size verdict has three states.- Whether your parsers write
0or null for an absent byte count is an assumption I’ve made and you should test. The Act Icasetreats a literal0asUnknownrather than as a measurement, and that choice is load-bearing: get it backwards and every unmeasured response is silently classifiedSmallBody, which is the one verdict that ranks below everything else — theisnotempty()failure re-created inside the fix for it. ASIM’s schema says whatDstBytesmeans; it does not say what a parser does when the source didn’t report it, and different parsers genuinely differ. There’s a second-order version of this that my first draft got wrong: I handled zero-as-null in thecaseand not in thecoalesce()feeding it, so a parser writing0into the precise column (HttpResponseBodyBytes) would shadow a perfectly good measurement in the coarse one (DstBytes) —coalescetakes the first non-null, and0is not null. The more accurate field made the answer worse. The query above collapses zero to null on each candidate before the coalesce, which is where that decision belongs. Settle the underlying question before you deploy:
_Im_WebSession(starttime=ago(7d))
| extend RespBytes = coalesce(
             column_ifexists("HttpResponseBodyBytes", long(null)),
             column_ifexists("DstBytes", long(null)))
| summarize
    Rows      = count(),
    NullBytes = countif(isnull(RespBytes)),
    ZeroBytes = countif(RespBytes == 0),
    Populated = countif(RespBytes > 0),
    MedianPop = percentile(RespBytes, 50),
    P99Pop    = percentile(RespBytes, 99)
    by EventVendor, EventProduct, EventType, HttpRequestMethod
| extend ZeroShare = round(todouble(ZeroBytes) / todouble(Rows), 3)
| order by Rows desc
Read it per parser, not in aggregate. A source with a high ZeroShare on GET traffic is using zero as its null and the RespBytes == 0 line is correct for it. A source with real nulls and almost no zeros is scrupulous, and for that source the line costs you nothing but buys you nothing either. A source where Populated is near zero across the board is telling you it has no byte counts at all, which means every finding from it will land in Unknown — good to know on the day you deploy rather than on the day it matters.
- If you don’t have ASIM, the
CommonSecurityLogversion is fine — with the right column names. Here it is, with the direction problem left visible rather than guessed at:
let lookback = 7d;
let ActuatorEndpoints = dynamic([
    "heapdump","env","configprops","beans","threaddump","mappings",
    "loggers","httpexchanges","httptrace","auditevents","jolokia","dump","trace"
]);
// Derived, for the same reason as the ASIM version: a prefilter that is not a superset
// of the authoritative list is a silent narrowing you cannot see from the results.
let PrefilterTerms = array_concat(ActuatorEndpoints, dynamic(["actuator"]));
CommonSecurityLog
| where TimeGenerated > ago(lookback)
| where isnotempty(RequestURL)
| where RequestURL has_any (PrefilterTerms)
| extend UrlLower = tolower(url_decode(RequestURL))
| extend PathOnly = trim_start(@"[a-z][a-z0-9+.\-]*://[^/]*", UrlLower)
| extend PathOnly = tostring(split(tostring(split(tostring(split(PathOnly,"?")[0]),"#")[0]),";")[0])
| extend NormPath = trim_end(@"/+", replace_regex(PathOnly, @"/{2,}", "/"))
| extend Segments = split(NormPath, "/")
| extend Matched  = set_intersect(Segments, ActuatorEndpoints)
| where array_length(Matched) > 0
| extend Endpoint    = tostring(Matched[0])
| extend EndpointIdx = array_index_of(Segments, Endpoint)
| extend BasePath = iff(EndpointIdx <= 0, "",
                        strcat_array(array_slice(Segments, 0, EndpointIdx - 1), "/"))
| extend Selector = strcat_array(array_slice(Segments, EndpointIdx + 1, -1), "/")
// BOTH directions are carried, because CEF does not tell you which one is the
// response. Run the validation query below, then delete the column you don't need.
// Zero is read as "not reported" on the way in, not on the way out -- otherwise
// NoByteCounts below reads a column full of zeros as a column full of measurements.
| extend
    BytesIn  = iff(tolong(column_ifexists("ReceivedBytes", long(null))) > 0,
                   tolong(column_ifexists("ReceivedBytes", long(null))), long(null)),
    BytesOut = iff(tolong(column_ifexists("SentBytes",     long(null))) > 0,
                   tolong(column_ifexists("SentBytes",     long(null))), long(null))
| extend BiggestSide = max_of(coalesce(BytesIn, long(0)), coalesce(BytesOut, long(0)))
// EventOutcome is documented as success/failure. Some sources write a status code,
// some write a word, some write "200 OK". Read it; don't gate on it.
| summarize
    Requests     = count(),
    Outcomes     = make_set(EventOutcome, 10),
    Endpoints    = make_set(Endpoint, 15),
    Paths        = make_set(NormPath, 10),
    BasePaths    = make_set_if(BasePath, isnotempty(BasePath), 10),
    Selectors    = make_set_if(Selector, isnotempty(Selector), 10),
    Devices      = make_set(DeviceName, 5),
    Vendors      = make_set(strcat(DeviceVendor, "/", DeviceProduct), 5),
    Agents       = make_set(RequestClientApplication, 5),
    MaxBytesIn   = max(BytesIn),
    MaxBytesOut  = max(BytesOut),
    MaxEitherSide= max(BiggestSide),
    ActiveDays   = dcount(bin(TimeGenerated, 1d)),
    FirstSeen    = min(TimeGenerated),
    LastSeen     = max(TimeGenerated)
    by SourceIP
| extend
    NoByteCounts = isnull(MaxBytesIn) and isnull(MaxBytesOut),
    Readable     = format_bytes(coalesce(MaxEitherSide, long(0))),
    Enumerating  = array_length(Endpoints) > 2
| order by MaxEitherSide desc, NoByteCounts desc, Enumerating desc, Requests desc
- Settle the byte direction empirically, once, and write the answer down. Download something large and known through the device, then look:
CommonSecurityLog
| where TimeGenerated > ago(1d)
| where isnotempty(RequestURL)
| summarize
    Records      = count(),
    WithIn       = countif(isnotnull(ReceivedBytes) and ReceivedBytes > 0),
    WithOut      = countif(isnotnull(SentBytes)     and SentBytes > 0),
    MedianIn     = percentile(ReceivedBytes, 50),
    MedianOut    = percentile(SentBytes, 50),
    P99In        = percentile(ReceivedBytes, 99),
    P99Out       = percentile(SentBytes, 99)
    by DeviceVendor, DeviceProduct, RequestMethod
| order by Records desc
On GET traffic the response side is one to three orders of magnitude larger than the request side, so the column with the big P99 on GET is your response column. That’s a five-second answer to a question you would otherwise argue about in a channel for a day. Do the same for EventOutcome: CommonSecurityLog | where isnotempty(RequestURL) | summarize count() by EventOutcome, DeviceProduct | order by count_ desc tells you in one screen whether you’re getting 200, success, 200 OK, or nothing.
not(ipv4_is_private(SourceIP))is the wrong filter, in the wrong place, for the wrong reason. Tuesday’s Detections 2 and 3 both scope to external sources only. The framing came from the source report, which is about internet scanning — but the detection you deploy is not the report. The two cases it deletes are the two you’d most want: a compromised internal host enumerating actuator endpoints across the estate, which is a post-exploitation credential harvest and the single most dangerous version of this activity; and the far more mundane case whereSourceIPis your own load balancer or ingress controller, in which case every request is private, the filter is a total blackout, and the true client is sitting inHttpRequestXffbeing ignored. The query above carriesProbablyInternalas a triage column and ranks on evidence instead. If you must reduce volume, reduce it on the service side — scope to hosts that actually answer — not on the client side.ipv4_is_private()on an IPv6 address does not do what you want, and the briefs flag this correctly. In a dual-stack estate, useipv4_is_private()andipv6_is_match()against the ULA and link-local ranges, or normalize first. Better: don’t make routability a filter at all, per the previous bullet.-
The prefilter can under-match on encoded paths, and that’s a real hole rather than a theoretical one.
url_has_any=PrefilterTermsruns against the raw URL, before myurl_decode(). A request written as/actuator/%68eapdumpcontains neither the termheapdumpnor anything else in the list, so the parser-level filter drops it and the authoritative test never sees it. There are exactly two honest options and no clever third one: keep the prefilter and accept that percent-encoded evasion is out of scope for the scheduled version, or drop theurl_has_anyargument entirely for a targeted hunt and pay for the full scan. I keep it for the scheduled rule and drop it for hunts, and I’d rather say that plainly than pretend the prefilter is free. Note the shape of this failure, because it generalizes: last week’s prefilter trap was about tokenization, this one is about encoding, and both have the same structure — a cheap filter sitting upstream of an authoritative test, where every row it wrongly drops is invisible.And I want to be explicit about the standard of evidence here, because it’s lower than the rest of this article. Microsoft documents what
url_has_anyfilters on — theUrlfield — and does not document whether individual parsers normalize or decode that value before the comparison, or whether the operator underneath is a term test or a substring test. Both of those are implementation details of each source-specific parser, and there is no reason to assume they’re uniform across the Palo Alto parser, the Squid parser, and whatever you wrote yourself. So the paragraph above is reasoning from the documented behaviour of the field, not from an observed result — which is exactly the kind of claim last week’s article got wrong abouthas_anyadjacency and had to correct in public. Don’t inherit my answer. Measure it, in your workspace, in about a minute:
// Does the parser-level prefilter see the same rows as an unfiltered scan?
// If Filtered < Unfiltered, the prefilter is dropping rows the authoritative
// test would have kept -- and those rows are invisible in the scheduled rule.
let Terms = dynamic(["actuator","heapdump"]);
let Unfiltered = _Im_WebSession(starttime=ago(7d))
| where tolower(url_decode(tostring(Url))) has_any ("actuator","heapdump","%68eapdump","%61ctuator");
let Filtered = _Im_WebSession(starttime=ago(7d), url_has_any=Terms);
union
    (Unfiltered | summarize Rows = count() | extend Population = "Decoded match, no prefilter"),
    (Filtered   | summarize Rows = count() | extend Population = "Parser prefilter applied")
If the two numbers match, your parsers decode before filtering and you can keep the prefilter with a clear conscience. If they don’t, the gap is the size of the hole, and you now know whether it’s worth paying for the full scan. Either way, write the answer in a comment next to the query, because the next person to read it will make the same assumption I did.
HttpRequestXffis attacker-controlled and it is still worth having. X-Forwarded-For is a request header; a client can send whatever it likes in it, and your edge may append rather than replace. So it is not an identity and must never be the entity key. It is a lead: if your edge appends, the rightmost value your edge added is trustworthy and the rest isn’t, and if you don’t know which your edge does, find out before you use the field for anything. It’s in the aggregation asXff, not in thebyclause, for exactly the reasons last week’s article gave for keeping actors out of the grouping.python-requests/2.34.2is a gift and it will not last. The ISC capture shows a default library user agent andadmin:adminbasic auth. Both are free corroborators and both cost the operator one line to change. Use them to rank, never to select. The same goes for a401immediately followed by a200on the same endpoint from the same source, which is the credential-guessing shape from that capture and is genuinely high-signal for as long as the attacker keeps guessing.- This is a lead, not a verdict, and the confirmation is not in the SIEM. A large
200on/…/heapdumpmeans the application generated and streamed a heap dump. What was in that heap dump is a question for the application owner, and it’s the only question that determines the blast radius. The first triage call is to whoever owns the service, and the question is: what secrets does this process hold in memory. Everything else — blocking the source, disabling the endpoint — is cleanup that doesn’t change what already left.
Act I hunts the request. Which assumes you can see the request. That assumption is doing more work than it looks like.
🥈 Act II: Spring Writes the Evidence For You
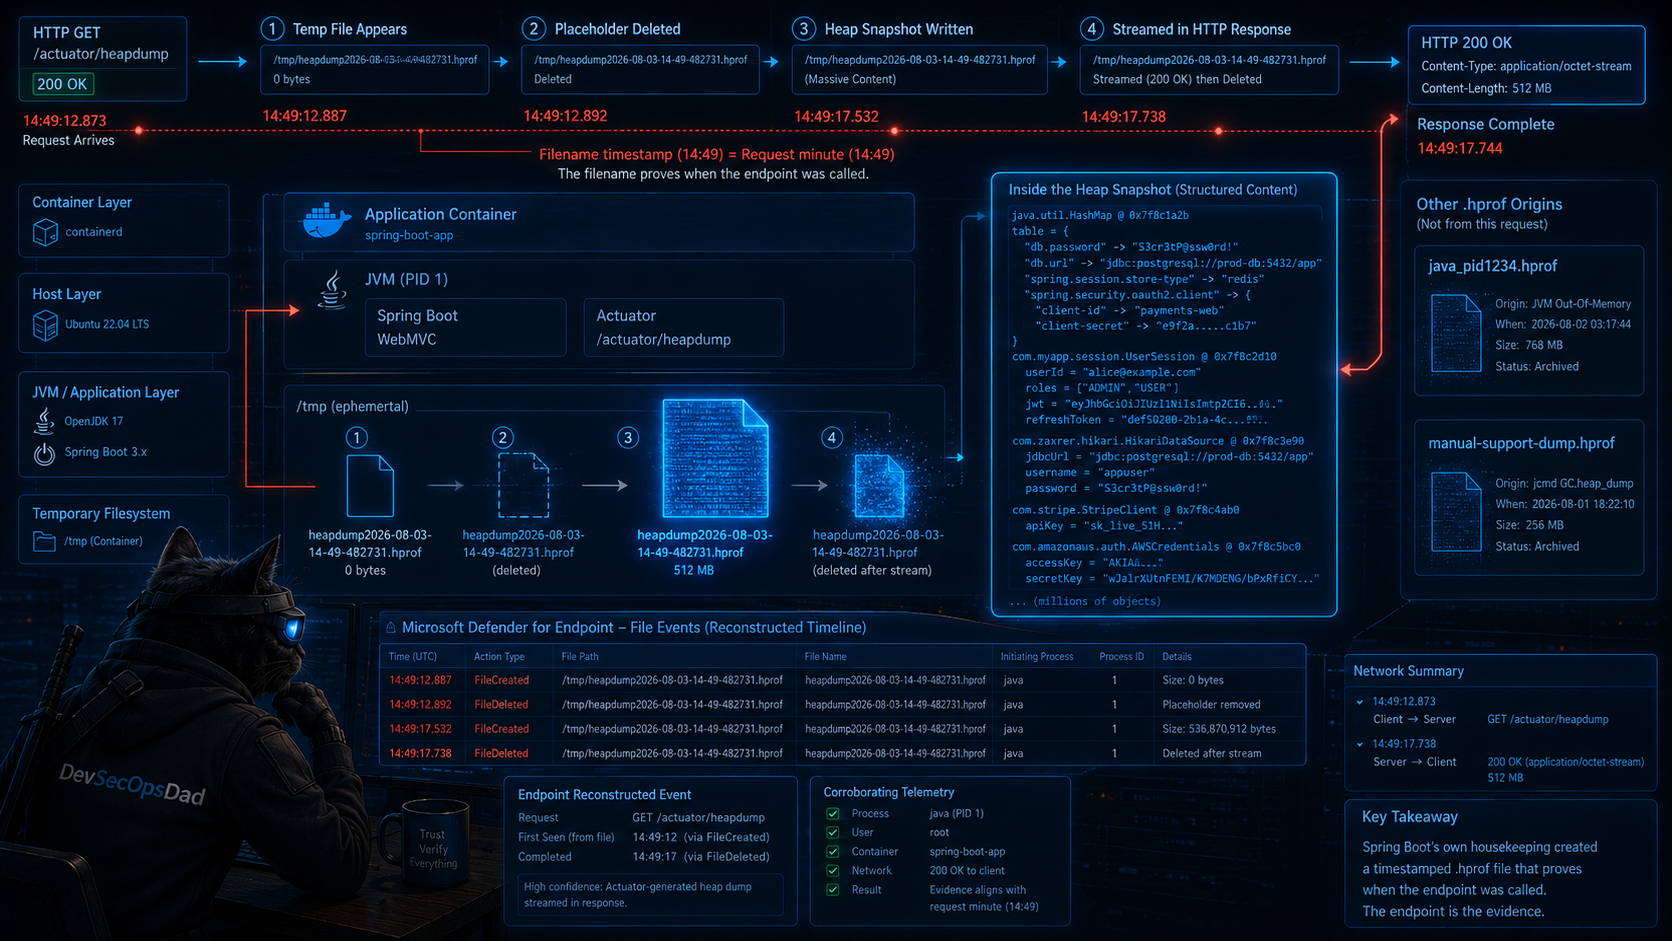
Everything in Act I depends on the web tier logging the URL path. Consider how often that’s actually true.
RequestURL in CommonSecurityLog is only populated when the CEF source is a proxy, WAF, or application delivery controller that emits HTTP request detail — the briefs say so, and it’s right. A generic firewall doesn’t. A network IDS mostly doesn’t. TLS-terminating load balancers vary. And an enormous number of Spring Boot applications in the real world are reachable on a container port through an ingress that logs to stdout and into a platform your SIEM has never heard of. The path /admin-api/actuator/heapdump reached the JVM; whether it reached your workspace is a completely separate question, and in a lot of estates the answer is no.
Monday’s Detection 4 went looking for the answer on the host, which is the right instinct. It searched DeviceFileEvents for .hprof files created by a Java process. And then its caveats said this:
Spring Boot’s heapdump endpoint in many configurations streams the heap dump directly to the HTTP response without writing a persistent file to disk; in such configurations, this detection will produce no results even when the endpoint is successfully accessed.
That is not how the endpoint works, and the correction turns Monday’s weakest candidate into the best detection in this article.
Read HeapDumpWebEndpoint in the Spring Boot source. It does this, in order:
File.createTempFile("heapdump" + yyyy-MM-dd-HH-mm + (live ? "-live" : ""), ".hprof")— creating an empty placeholder in the JVM’s temp directory.file.delete()— immediately, becauseHotSpotDiagnosticMXBean.dumpHeap()refuses to write to a path that already exists.heapDumper.dumpHeap(file, live)— the JVM writes the entire heap to that path.- It returns a
TemporaryFileSystemResourcewrapping the file, which streams it to the response and deletes it once the response is written.
So the file is not skipped. The file is written, in full, to disk, every single time — and then removed. What Monday’s caveat described as “streaming without writing” is actually “writing, streaming, and cleaning up,” and the difference is the entire detection, because MDE records the create and the delete as events regardless of whether the file survives.
And the filename is not incidental. Look at what Spring encodes into it:
| Component | Value | What it tells you |
|---|---|---|
| Prefix | heapdump |
This came from the web endpoint, not from an operator |
| Date | yyyy-MM-dd-HH-mm |
The minute the HTTP request arrived, in the JVM’s local time |
| Optional | -live |
The caller passed ?live=true — a deliberate parameter, not a stray click |
| Suffix | random digits + .hprof |
createTempFile uniqueness |
That naming pattern belongs to the actuator endpoint and to nothing else. A JVM dumping on out-of-memory writes java_pid<pid>.hprof. An operator running jmap or jcmd writes wherever they said to write. Nothing else in the Java ecosystem produces heapdump2026-08-03-14-49<digits>.hprof in a temp directory.
Which means: the filename is proof that an HTTP request hit the heapdump endpoint. Not evidence that a heap dump happened — evidence that someone called the web endpoint. On a host where you have no web logs at all, DeviceFileEvents will tell you the request occurred, and the embedded timestamp will tell you the minute it arrived, to the minute, which is a join key back into whatever request logs you do have.
That’s an unusual thing for endpoint telemetry to be able to say about a network event, and it exists purely because the developers needed a unique temp filename and reached for a timestamp.
The KQL
let lookback = 30d;
// Spring's HeapDumpWebEndpoint: createTempFile("heapdump" + yyyy-MM-dd-HH-mm
// + optional "-live", ".hprof"). The trailing digits are createTempFile's uniqueness.
let ActuatorDumpRegex = @"^heapdump\d{4}-\d{2}-\d{2}-\d{2}-\d{2}(-live)?\d+\.hprof$";
// -XX:+HeapDumpOnOutOfMemoryError writes java_pid<pid>.hprof to the working directory.
let OomDumpRegex      = @"^java_pid\d+\.hprof$";
// Kept for reference in triage output, NOT used as a filter -- see the note below.
let DumpTools         = dynamic(["jmap","jcmd","jattach","jhsdb"]);
let DumpEvents = DeviceFileEvents
| where Timestamp > ago(lookback)
// endswith on the extension is the only safe prefilter. `FileName has "heapdump"`
// does NOT match heapdump2026-08-03-14-49123.hprof -- see the note below.
| where FileName endswith ".hprof" or FileName endswith ".phd"
| extend NameLower = tolower(FileName)
| extend DumpOrigin = case(
      NameLower matches regex ActuatorDumpRegex, "ActuatorWebEndpoint",
      NameLower matches regex OomDumpRegex,      "JvmOutOfMemory",
                                                 "OperatorOrUnknown")
// The minute in the filename is the request arrival time in the JVM's LOCAL zone.
// Extracted as a string on purpose: comparing it to TimeGenerated tells you the
// host's UTC offset, which you need before you join it to anything.
| extend FilenameStamp = extract(@"^heapdump(\d{4}-\d{2}-\d{2}-\d{2}-\d{2})", 1, NameLower)
| extend LiveOnly = NameLower matches regex @"^heapdump[\d\-]+-live\d+\.hprof$"
| project
    Timestamp, DeviceId, DeviceName, ActionType, FileName, FolderPath,
    FileSize = column_ifexists("FileSize", long(null)),
    DumpOrigin, FilenameStamp, LiveOnly,
    Process     = InitiatingProcessFileName,
    ProcessPath = InitiatingProcessFolderPath,
    ProcessId   = InitiatingProcessId,
    Account     = InitiatingProcessAccountName,
    CommandLine = InitiatingProcessCommandLine;
// Lane 2 -- the BENIGN corroborator. Not an exclusion. An operator-run jcmd on the
// same host in the same window makes a dump explainable; its ABSENCE makes one
// unexplained. Excluding these outright would delete the evidence that a dump was fine.
// `contains`, not `has_any`. "GC.heap_dump", "-dump:" and ".hprof" are MULTI-TOKEN
// needles -- the dot, underscore and colon are separators, not content, so a term test
// on them leans on adjacency behaviour Microsoft doesn't document. Substring matching
// is slower and unambiguous, and this lane is tiny. Same argument as the Act I
// prefilter, applied to a needle instead of a haystack.
let DiagnosticRuns = DeviceProcessEvents
| where Timestamp > ago(lookback)
| where ProcessCommandLine contains "heap_dump"
     or ProcessCommandLine contains "heapdump"
     or ProcessCommandLine contains "dumpHeap"
     or ProcessCommandLine contains "-dump:"
     or ProcessCommandLine contains ".hprof"
| summarize
    DiagRuns     = count(),
    // The TIMELINE, not its endpoints. Collapsing thirty days to min/max and then
    // asking a temporal question of the aggregate is the bug this list exists to
    // prevent -- see the note below.
    DiagTimes    = make_list(Timestamp, 2000),
    DiagCommands = make_set(ProcessCommandLine, 5),
    DiagTools    = make_set(FileName, 5),
    DiagAccounts = make_set(AccountName, 5)
    by DeviceId;
DumpEvents
// Entity = (device, file). One file produces multiple rows: createTempFile creates it,
// Spring deletes the placeholder, the JVM writes it, the response streams, Spring
// deletes it again. Four to five events, one artifact, one finding.
| summarize
    Actions       = make_set(ActionType),
    EventCount    = count(),
    FirstEvent    = min(Timestamp),
    LastEvent     = max(Timestamp),
    MaxFileSize   = max(FileSize),
    Folders       = make_set(FolderPath, 3),
    Processes     = make_set(Process, 5),
    ProcessPaths  = make_set(ProcessPath, 5),
    Accounts      = make_set(Account, 5),
    CommandLines  = make_set(CommandLine, 3),
    DeviceNames   = make_set(DeviceName, 3),
    Origins       = make_set(DumpOrigin, 3),
    Stamps        = make_set_if(FilenameStamp, isnotempty(FilenameStamp), 3),
    LiveRequested = countif(LiveOnly) > 0
    by DeviceId, FileName
| extend
    Created      = set_has_element(Actions, "FileCreated"),
    Deleted      = set_has_element(Actions, "FileDeleted"),
    // DumpOrigin is a pure function of FileName and FileName is in the by clause,
    // so this set is always a singleton. Indexing it is safe here and nowhere else.
    Origin       = tostring(Origins[0]),
    LifetimeSec  = tolong(datetime_diff('second', LastEvent, FirstEvent)),
    SizeReadable = format_bytes(coalesce(MaxFileSize, long(0)))
// Create AND delete, with the actuator naming, is the complete protocol signature.
| extend WebEndpointConfirmed = Origin == "ActuatorWebEndpoint" and Created and Deleted
| join kind=leftouter DiagnosticRuns on DeviceId
| project-away DeviceId1
// mv-apply over an empty or absent array DROPS the row -- which would delete exactly
// the hosts with NO diagnostic activity, i.e. every finding that matters. Seed one
// null element so those rows survive the expansion and score zero.
| extend DiagTimes = iff(isnull(DiagTimes) or array_length(DiagTimes) == 0,
                         dynamic([null]), DiagTimes)
| mv-apply DiagTime = DiagTimes to typeof(datetime) on (
    summarize NearbyDiagRuns =
        countif(DiagTime between ((FirstEvent - 15m) .. (LastEvent + 15m)))
  )
| extend NearbyDiagRuns = coalesce(NearbyDiagRuns, 0)
| extend
    DiagnosticNearby = NearbyDiagRuns > 0,
    RenamedInWindow  = array_length(DeviceNames) > 1
// An actuator-named dump with NO operator diagnostic activity anywhere near it is the
// finding. With one, it's probably a human being doing their job -- still worth a look,
// because "an operator ran jcmd" and "an attacker called the endpoint while an operator
// happened to be working" look identical from here.
| extend Verdict = case(
      WebEndpointConfirmed and not(DiagnosticNearby), "WebEndpoint-Unexplained",
      WebEndpointConfirmed,                           "WebEndpoint-OperatorNearby",
      Origin == "JvmOutOfMemory",                     "OutOfMemory",
                                                      "Operator-Or-Unknown")
| order by WebEndpointConfirmed desc, NearbyDiagRuns asc, LiveRequested desc,
           MaxFileSize desc, LastEvent desc
The line that does the work
| where FileName endswith ".hprof" or FileName endswith ".phd"
That’s the prefilter, and it’s the only safe one available — which is the correction, because the obvious alternative is in Monday’s query and it does not work.
Monday filtered with where FileName endswith ".hprof" or FileName has "heapdump". The first half is fine. The second half can never match a real Spring heapdump filename, and the reason is the same term-matching behaviour that keeps showing up in these articles from different angles.
has tests for a whole indexed term. KQL breaks values into terms on non-alphanumeric characters, so heapdump2026-08-03-14-49123456.hprof decomposes into the terms heapdump2026, 08, 03, 14, 49123456, and hprof. The term heapdump is not among them — heapdump2026 is a different term, because the digits are alphanumeric and nothing separates them from the letters. has "heapdump" asks whether a term exactly equal to heapdump is present. It isn’t. The clause returns false on every actuator-generated dump in your estate.
It doesn’t error, it doesn’t return anything strange, and it doesn’t cost anything — because the endswith ".hprof" on the other side of the or is quietly carrying the whole query. Which is precisely why this survives review. The predicate is dead, the query works, and the day somebody “optimizes” by dropping the extension check in favour of the more specific-looking name check, the detection goes to zero and looks healthy. If you want to match the prefix, startswith "heapdump" or a regex are the operators that ask that question; has is not, and no amount of adjacent-token reasoning makes it one.
The authoritative test is the regex:
| extend NameLower = tolower(FileName)
| extend DumpOrigin = case(
      NameLower matches regex ActuatorDumpRegex, "ActuatorWebEndpoint",
      NameLower matches regex OomDumpRegex,      "JvmOutOfMemory",
                                                 "OperatorOrUnknown")
and note that it doesn’t just detect, it classifies. This is the part I’d take to production tomorrow. Three origins produce .hprof files and they mean three completely different things:
heapdump<date>[-live]<digits>.hprof→ somebody called the HTTP endpoint. This is a network event you’re reading off the disk.java_pid<pid>.hprof→ the JVM hitOutOfMemoryErrorwith-XX:+HeapDumpOnOutOfMemoryErrorset. That’s a stability event — and occasionally an attacker-induced one, since a reliable OOM is a denial of service with a credential file as a souvenir.- Anything else → an operator with
jmap,jcmd, or a profiler, writing to a path they chose.
A detection that returns all three as “heap dump created” hands the analyst a triage problem. A detection that separates them hands the analyst an answer. The cost of the classification is one case statement and two regexes, and it converts the noisiest lane in this table — APM agents and CI runners and out-of-memory crashes, all of which really do generate .hprof files constantly — from false positives into labelled rows.
And the -live flag deserves its own sentence. ?live=true restricts the dump to reachable objects. It is a smaller, faster, cleaner dump, and it is a parameter you pass on purpose. A monitoring integration might. A browser click won’t. It’s not evidence by itself, but it’s in the ranking because the population of callers who know that parameter exists is small and interesting.
The lane that isn’t an exclusion
DiagnosticRuns is the design choice in Act II I’d most want copied, and it’s the inverse of what the tuning instinct says to do.
Every triage runbook in the briefs, correctly, lists “an operator generated a heap dump during troubleshooting” as the leading benign explanation. The natural next step is to write that into the query as an exclusion — drop hosts where jmap or jcmd ran, drop dumps by the APM agent’s account, drop the CI runners. Don’t. Every one of those exclusions is a place to hide, and more importantly, they throw away the fact that would have made the finding actionable.
So DiagnosticRuns is joined leftouter and lands in a count. A dump with operator diagnostic activity fifteen minutes either side is probably a person doing their job — and it ranks below one with none, rather than being deleted. The Verdict column says which it is, in words, and the analyst reads that instead of trusting an exclusion list they didn’t write.
There’s a second reason, and it’s the honest one: DiagnosticNearby being true does not mean the dump was benign. It means an operator was working on that host in that window, which is also an excellent time for something else to happen unnoticed. The flag lowers the rank and it does not close the case. An exclusion would have closed the case, silently, forever, without anybody deciding to.
And then I built an exclusion anyway, out of a max(). My first version of this lane summarized thirty days of process activity down to one row per device carrying DiagFirst and DiagLast, and then tested proximity like this:
| extend DiagnosticNearby = isnotnull(DiagRuns)
        and DiagLast between ((FirstEvent - 15m) .. (LastEvent + 15m))   // don't
That is an aggregate that has discarded the timeline being interrogated about the timeline — the same defect as last week’s Timestamp = min(Timestamp) before a union, in a query I wrote two sections after describing it.
It fails in both directions, and the second one is the dangerous half. The obvious failure is a miss: jcmd runs on days 1, 5 and 20, the dump happens on day 5, DiagLast is day 20, and a genuinely explained dump reads as unexplained. Annoying, and safe — it over-alerts.
The failure that actually matters is the opposite. Any host running a monitoring agent or a scheduled JVM diagnostic keeps DiagLast permanently recent. DiagLast then falls inside every window on that device, so every actuator-named dump on it is labelled WebEndpoint-OperatorNearby and down-ranked — permanently, on the strength of a diagnostic run that had nothing to do with it. That’s a hiding place, on exactly the hosts most likely to be running something that dumps heaps, and it’s the thing this section opens by promising not to build. An exclusion list would at least have been visible. A max() is not.
The fix keeps the timeline and evaluates proximity per event: make_list(Timestamp, 2000) instead of min/max, then an mv-apply that counts how many diagnostic runs actually fall in this finding’s window. NearbyDiagRuns is a better triage column than the boolean was, too — one operator command adjacent to a dump reads very differently from forty. The iff(isnull(DiagTimes) …, dynamic([null]), DiagTimes) seed above it is not decoration: mv-apply over an empty array drops the row, and the rows with no diagnostic activity are the entire point of the query.
One caveat on the fix, because it reintroduces the original bug in a quieter form if you ignore it: make_list is capped. A host that exceeds the cap loses timestamps silently, and the ones it loses are arbitrary. If your diagnostic volume is high, either pre-bin before the list — summarize by DeviceId, bin(Timestamp, 5m) — or scope the diagnostic lookback to the finding window rather than the full thirty days.
The filter above it needed two corrections of its own. The old version led with where FileName in~ (DumpTools) or ProcessCommandLine has_any (…) and then applied a second, broader command-line filter underneath it — which made the first clause dead code, subsumed entirely by the second, including the deliberately-broad "java" entry that was doing nothing at all. And the needles themselves were wrong for the operator: has_any is a term test, and "GC.heap_dump", "-dump:" and ".hprof" are multi-token strings whose separators aren’t part of any term. That’s the inferred-adjacency mistake this article corrects the briefs for twice. contains is the operator that asks the question I meant.
Note the join key too: DeviceId alone, and the grouping key is DeviceId, FileName. DeviceName is in the aggregation as DeviceNames with a RenamedInWindow flag, for the same reason as always — a label that changes on rename and collides across a fleet is not an identity, and a rename inside a thirty-day window would split one compromised host into two half-findings, each below the bar.
Keeping it honest
ActuatorWebEndpoint with Created and Deleted and not(DiagnosticNearby) is a scheduled rule I’d deploy this week. The rest of it is a hunt. The gap between those two states:
- The whole detection rests on a temp file that exists for seconds. MDE’s
DeviceFileEventsis an event stream, not a filesystem scan, so the transience doesn’t matter to the query — but it matters enormously to the response. By the time anyone reads the alert, the file is gone, and there is no way to recover what was in it. You cannot answer “what did they get” from the artifact. You answer it from the application owner, who knows what that process holds in memory. Plan the runbook around that or the first real one will be an hour of people trying to find a deleted file. -
Act II assumes MDE emits an event for a file that exists for a few seconds, and that assumption is untested here. The whole detection is a
FileCreatedand aFileDeletedon an artifact whose entire lifetime is one HTTP request.DeviceFileEventsis an event stream rather than a filesystem scan, so transience shouldn’t matter — but “shouldn’t” is a design argument, not a measurement, and MDE for Linux has documented coverage variation around temp paths, exclusion policies, and agent versions. If the events don’t fire in your estate, this query is elegant and permanently empty, and empty reads as clean. Prove the pipeline before you schedule anything built on it: on an onboarded lab host,dd if=/dev/urandom of=$(mktemp --suffix=.hprof) bs=1M count=50 && sleep 2 && rm -f /tmp/*.hprof, then check whether both halves came back:DeviceFileEvents | where TimeGenerated > ago(30m) | where FileName endswith ".hprof" | summarize Actions = make_set(ActionType), Events = count(), First = min(Timestamp), Last = max(Timestamp) by DeviceId, DeviceName, FileNameBoth
FileCreatedandFileDeletedpresent means the pipeline works andWebEndpointConfirmedis a real test. Only one of them means theCreated and Deletedconjunction is a silent filter that can never be satisfied, and you should rank on the naming alone instead. Neither means you have an onboarding or exclusion problem — which is a far more valuable finding than a quiet dashboard. Do this per platform, because Windows, Linux, and containerized Linux are three separate answers. Thesleep 2is deliberate: a create and delete in the same millisecond is a harsher test than the real thing, since an actual dump takes seconds to write and stream. - Container workloads are the coverage question, and most Spring Boot is containerized. If the JVM runs in a container and the MDE agent runs on the host, the temp file lands in the container’s writable layer and shows up under an overlay path — often visible, sometimes not, depending on your runtime and MDE version. If the agent isn’t on the node at all, none of this exists. Check before you rely on it:
DeviceFileEvents | where TimeGenerated > ago(7d) | where InitiatingProcessFileName has_any ("java","javaw") | summarize Files = count(), Devices = dcount(DeviceId) by tostring(split(FolderPath, "/")[1]) | order by Files descwill show you whether you’re seeing/tmp,/var/lib/docker/overlay2/..., both, or nothing. java.io.tmpdiris not always/tmp, and that’s a feature here.createTempFilewrites to whateverjava.io.tmpdirpoints at — which containers, systemd units, and app servers all commonly override. The query deliberately does not scope byFolderPath, for the same reason last week’slogAzure.txthunt didn’t: the location is unpredictable and the location is evidence. Where the file landed tells you which unit the JVM runs under.- The regex is a version contract, and here is exactly how much I verified. I read
HeapDumpWebEndpointat 2.0.x tags and the current API documentation, and both showFile.createTempFile("heapdump" + yyyy-MM-dd-HH-mm + (live ? "-live" : ""), ".hprof"). I did not read the 3.x source, so treat the date component as verified-on-2.x and assumed-forward. That matters, because Spring has changed this filename before, and the claim the classifier rests on — that nothing else in the Java ecosystem writesheapdump<date>[-live]<digits>.hprof— is a universal statement built by reading one class. Settle it in ten minutes rather than inheriting it: on a lab instance of whatever major version you actually run,curl -O http://host:port/<your-base-path>/heapdump, thenDeviceFileEvents | where TimeGenerated > ago(15m) | where FileName endswith ".hprof" | project Timestamp, ActionType, FileName, FolderPath, InitiatingProcessFileName. Read the real filename with your own eyes, write your version number in a comment next to the regex, and repeat it after a Spring upgrade. An OpenJ9 JVM produces.phdrather than HPROF, which the extension prefilter covers and the classifier does not. Note the direction this fails in: if the naming changes you get a population shift intoOperatorOrUnknownrather than silence, which is why the prefilter is deliberately broader than the classifier rather than equal to it. InitiatingProcessNameis not a column andFileReadis not an ActionType. Neither error is in Monday’s query, but both are in Saturday’s Detection 1, which hunts the Rails file read withwhere InitiatingProcessName has_any (railsProcesses)andwhere ActionType in ("FileRead", "FileAccessed"). The column isInitiatingProcessFileName;InitiatingProcessNamedoesn’t resolve, so the query is a semantic error. AndDeviceFileEventsActionTypevalues areFileCreated,FileModified,FileRenamed, andFileDeleted— MDE does not emit generic file reads to that table, which is exactly the blind spot Thursday’s and Saturday’s briefs both flag in their own callouts. Two independent problems, and the second one is the interesting one, because it means arbitrary-file-read vulnerabilities are structurally invisible toDeviceFileEvents. You detect them by their consequences — a child process, an outbound connection, an authentication with a stolen secret — not by the read. Which is the same lesson as Act I from the other end: you cannot detect a read, only its effects..hprofvolume is not zero, and that’s the point of the classifier. APM agents, CI runners executing tests that OOM, and genuine production incidents all generate these. RunDeviceFileEvents | where TimeGenerated > ago(30d) | where FileName endswith ".hprof" | summarize Files = dcount(FileName), Devices = dcount(DeviceId) by InitiatingProcessFileName, InitiatingProcessAccountName | order by Files descbefore you schedule anything, and expect theOperatorOrUnknownbucket to be the big one. IfActuatorWebEndpointis non-zero in that baseline and nobody can explain it, you have your answer before you deploy the rule.- This is the detection you keep when the web tier goes dark, and the one you correlate with when it doesn’t.
FilenameStampis a local-time minute;Timestampis UTC. Compare them once per host to learn the offset, then use the stamp as a join key back into Act I. When both fire on the same minute, you have the request, the source IP, the response size, and the file — which is a complete incident narrative assembled from two telemetry domains that share no common field.
Act I hunts the request. Act II hunts the artifact. The last query stops hunting the attacker entirely.
🎖 Honorable Mention: Stop Detecting the Scan. Detect the Answer.

All three of the briefs’ web-tier heapdump detections group by SourceIP. Every one of them ranks by request count. Every one of them is asking: who is scanning us?
That question has no useful answer. Actuator scanning is background radiation. It runs continuously, from thousands of hosts, forever, and it will keep running after you block every address in the result set. A detection that ranks scanners by volume produces a list that is always populated, never actionable, and identical next week. It is a weather report.
Flip the entity and the question becomes finite: which of my services answer?
That population is small. It is enumerable. It is fixable — every row is a configuration change with an owner, and when you fix it the row disappears and does not come back. It is also, crucially, the only version of this that catches the exposure before somebody finds it, because your own monitoring, health checks, and internal traffic will trip an exposed actuator endpoint long before an external scanner does.
The discriminator is the status code, and it’s beautifully clean. A 404 means the endpoint isn’t mounted — that’s a healthy application telling you so. A 401 or 403 means it’s mounted and protected, which is a finding of a different severity. A 200 on /…/env or /…/heapdump means the application will hand its secrets to whoever asks, and it means that regardless of who asked.
let lookback = 30d;
let ActuatorEndpoints = dynamic([
    "heapdump","env","configprops","beans","threaddump","mappings",
    "loggers","httpexchanges","httptrace","auditevents","jolokia","dump","trace",
    "health","info","metrics","shutdown","restart","refresh"
]);
let SecretBearing = dynamic(["heapdump","env","configprops","jolokia","dump"]);
let StateChanging = dynamic(["shutdown","restart","refresh","loggers"]);
// DERIVED. This one mattered more than Act I's: `health` and `info` are on the endpoint
// list deliberately, so that base-path recovery works on services where the only thing
// anyone ever requests is the health check -- and my hand-written prefilter omitted
// both, which defeated the entire reason they were there.
let PrefilterTerms = array_concat(ActuatorEndpoints, dynamic(["actuator"]));
_Im_WebSession(starttime=ago(lookback), url_has_any=PrefilterTerms)
| extend UrlLower = tolower(url_decode(tostring(Url)))
| extend PathOnly = trim_start(@"[a-z][a-z0-9+.\-]*://[^/]*", UrlLower)
| extend PathOnly = tostring(split(tostring(split(tostring(split(PathOnly,"?")[0]),"#")[0]),";")[0])
| extend NormPath = trim_end(@"/+", replace_regex(PathOnly, @"/{2,}", "/"))
| extend Segments = split(NormPath, "/")
// Position-independent, same as Act I -- /health/{component}, /metrics/{name} and
// /env/{property} all put the endpoint ID in the middle of the path.
| extend Matched = set_intersect(Segments, ActuatorEndpoints)
| where array_length(Matched) > 0
| extend Endpoint    = tostring(Matched[0])
| extend EndpointIdx = array_index_of(Segments, Endpoint)
// The management BASE PATH, recovered from the data rather than assumed. This is the
// output that goes to the platform team: it tells them where their surface actually is.
| extend BasePath = iff(EndpointIdx <= 0, "",
                        strcat_array(array_slice(Segments, 0, EndpointIdx - 1), "/"))
| extend Selector = strcat_array(array_slice(Segments, EndpointIdx + 1, -1), "/")
// Same three-state result verdict as Act I. EventResult "Success" is ANY status below
// 400, so it cannot stand in for a 200 -- and on this endpoint the sub-400 response
// you'll actually meet is a 302 to a login page, i.e. the healthy case.
| extend StatusRaw  = coalesce(tostring(EventResultDetails),
                               tostring(column_ifexists("EventOriginalResultDetails","")))
| extend StatusCode = toint(extract(@"(\d{3})", 1, StatusRaw))
| extend AnswerVerdict = case(
      StatusCode == 200,                   "Served",
      StatusCode between (300 .. 399),     "Redirected",
      StatusCode in (401, 403),            "AuthWall",
      StatusCode == 404,                   "NotPresent",
      isnotnull(StatusCode),               "OtherStatus",
      tostring(EventResult) =~ "Success",  "MaybeServed",
                                           "NotServed")
| extend RespBodyBytes = column_ifexists("HttpResponseBodyBytes", long(null))
| extend RespDstBytes  = column_ifexists("DstBytes", long(null))
| extend RespBytes = coalesce(iff(RespBodyBytes > 0, RespBodyBytes, long(null)),
                              RespDstBytes)
// A row with no destination identity is NOT dropped. It is bucketed. An unattributable
// 200 on /heapdump is a telemetry finding AND possibly a security one, and `where
// isnotempty(Service)` -- which is what I originally wrote here -- deletes both.
| extend
    Service   = coalesce(tostring(column_ifexists("HttpHost","")),
                         tostring(column_ifexists("DstFQDN","")),
                         tostring(DstIpAddr),
                         "UNATTRIBUTED"),
    UserAgent = tostring(column_ifexists("HttpUserAgent", ""))
// ipv4_is_private() returns null for a v6 literal, and not(null) is null, so a v6
// client would count as neither internal nor external. Default it to external --
// the safer direction for a surface report.
| extend ExternalClient = coalesce(not(ipv4_is_private(tostring(SrcIpAddr))), true)
// Entity = the SERVICE and the ENDPOINT. One row per thing you might have to fix.
| summarize
    Requests        = count(),
    ServedHits      = countif(AnswerVerdict == "Served"),
    MaybeServedHits = countif(AnswerVerdict == "MaybeServed"),
    RedirectHits    = countif(AnswerVerdict == "Redirected"),
    NotFoundHits    = countif(AnswerVerdict == "NotPresent"),
    AuthWallHits    = countif(AnswerVerdict == "AuthWall"),
    // A 500 or a 405 is not "not mounted" -- it is a mounted endpoint failing. Counted,
    // because without this counter those rows fall through the case below into
    // "OK - not mounted" and get filtered out of the report entirely.
    OtherStatusHits = countif(AnswerVerdict == "OtherStatus"),
    DistinctClients = dcount(SrcIpAddr),
    ExternalClients = dcountif(SrcIpAddr, ExternalClient),
    MaxRespBytes    = max(RespBytes),
    BasePaths       = make_set_if(BasePath, isnotempty(BasePath), 5),
    Selectors       = make_set_if(Selector, isnotempty(Selector), 10),
    SampleClients   = make_set(SrcIpAddr, 10),
    Statuses        = make_set(StatusRaw, 10),
    Verdicts        = make_set(AnswerVerdict, 8),
    Agents          = make_set(UserAgent, 5),
    ActiveDays      = dcount(bin(TimeGenerated, 1d)),
    FirstSeen       = min(TimeGenerated),
    LastSeen        = max(TimeGenerated)
    by Service, Endpoint
// Exposed == it returned a CONFIRMED 200 at least once. Not "answered a lot". Once.
// A redirect is not an answer -- it is usually the auth wall doing its job.
| extend
    Exposed         = ServedHits > 0,
    PossiblyExposed = ServedHits == 0 and MaybeServedHits > 0,
    Protected       = ServedHits == 0 and MaybeServedHits == 0
                          and (AuthWallHits > 0 or RedirectHits > 0),
    // Mounted and failing. Evidence of a management surface, just not of a served one.
    MountedErroring = ServedHits == 0 and MaybeServedHits == 0
                          and AuthWallHits == 0 and RedirectHits == 0
                          and OtherStatusHits > 0,
    NotPresent      = ServedHits == 0 and MaybeServedHits == 0
                          and AuthWallHits == 0 and RedirectHits == 0
                          and OtherStatusHits == 0 and NotFoundHits > 0,
    LeaksSecrets    = Endpoint in (SecretBearing),
    ChangesState    = Endpoint in (StateChanging),
    FoundExternally = ExternalClients > 0,
    MaxReadable     = format_bytes(coalesce(MaxRespBytes, long(0)))
// The size field resolves most of the unverified band without a status code: a 302
// carries a few hundred bytes and a heap dump carries hundreds of megabytes. Null
// MaxRespBytes makes this null, the case falls through, and the row stays unverified.
| extend LikelyServed = PossiblyExposed and MaxRespBytes >= 1048576
| extend Confirmed = Exposed or LikelyServed
| extend Priority = case(
      Confirmed and LeaksSecrets and FoundExternally, "P1 - secrets, externally reachable",
      Confirmed and ChangesState and FoundExternally, "P1 - state change, externally reachable",
      Confirmed and LeaksSecrets,                     "P2 - secrets, internal callers only",
      Confirmed and ChangesState,                     "P2 - state change, internal callers only",
      Confirmed,                                      "P3 - management surface exposed",
      PossiblyExposed and LeaksSecrets,               "P4 - unverified, secrets endpoint answered sub-400",
      PossiblyExposed,                                "P4 - unverified, sub-400 with no status code",
      Protected,                                      "P5 - mounted, authenticated or redirected",
      MountedErroring,                                "P5 - mounted, erroring",
                                                      "OK - not mounted")
| extend Unattributed = Service == "UNATTRIBUTED"
| where not(Priority startswith "OK")
| order by Priority asc, MaxRespBytes desc, ExternalClients desc, ServedHits desc
The line that does the work
| extend Exposed = ServedHits > 0
One. Not a threshold, not a rate, not a baseline — one confirmed 200, ever, in thirty days.
This is the opposite of everything else in this article, and it’s worth being explicit about why the same author is arguing both sides. Elsewhere I’ve spent paragraphs objecting to volume gates, and the objection stands: you cannot separate a beacon from a business integration by counting, and CalendarOps > 20 or RequestCount > 1 are thresholds placed inside a distribution where the two populations overlap.
But this query isn’t measuring behaviour. It’s measuring configuration, and configuration is binary. An endpoint either serves or it doesn’t. A service that returned 200 on /…/env once is exactly as misconfigured as one that returned it ten thousand times — the difference between those two numbers is how many people have looked, not how exposed you are. Counting would rank a heavily-scanned staging box above a quiet production service holding live payment credentials, and the quiet one is the emergency.
Note the word confirmed, because the earlier version of this line said AnsweredHits and that was wrong in a way that mattered more here than anywhere else in the article. Answered folded in ASIM’s EventResult == "Success", which is any status below 400 — so a 302 to a login page counted as a service handing out its secrets. That’s not a marginal false positive. The redirect-to-login is the protected configuration; the old logic took the healthiest possible row and printed P1 - secrets, externally reachable next to it. Hand a platform team a P1 list whose top entries are services they secured correctly and you have not produced a fix list, you have produced a reason to stop opening your emails.
Hence the split. Exposed needs a real 200. PossiblyExposed is the sub-400-with-no-code band, it gets its own P4 label with the word unverified in it, and it is promoted to the confirmed bands only when MaxRespBytes clears the megabyte floor — because a redirect is a few hundred bytes and a heap dump is a few hundred megabytes, and when the status code is missing the body size answers the question anyway. The three-state discipline the article spends Act I arguing for applies to the status field exactly as much as to the byte count, and the first draft of this query only applied it to one of them.
The BasePath extraction is the other line worth stealing, and it is the deliverable. The query recovers where your management surface is actually mounted, from your own traffic, rather than assuming /actuator. That’s the answer to a question the platform team probably cannot answer from memory across a hundred services — and it’s also the input to every other query in this article, because once you know your real base paths you can tighten the prefilters honestly instead of hopefully.
Note the negative-result lanes too. NotPresent — endpoints that only ever returned 404 — is filtered out of the output, and it is the row you want to see in a validation run. So is Protected, which now covers both the auth wall and the redirect that usually implements it. If your entire result set is NotPresent, either you’re clean or your parser isn’t populating status codes; if it’s all P4 - unverified, it’s definitely the second one, and you should fix the telemetry before you file any of this as good news.
Two lanes exist because the first draft of this query dropped them on the floor, and both failures are the same shape as everything else in this article. The first: a service that only ever returned 500 or 405 on /…/env has ServedHits, MaybeServedHits, AuthWallHits, RedirectHits and NotFoundHits all at zero, so it fell through every branch of the case to OK - not mounted — and then the where on the next line deleted it. A mounted endpoint throwing exceptions was reported as an endpoint that doesn’t exist. OtherStatusHits and the P5 - mounted, erroring lane exist so that a status code nobody anticipated produces a row instead of a reassurance.
The second: I opened with | where isnotempty(Service), which is the exact clause this article spends a thousand words condemning, sitting in my own query. If HttpHost, DstFQDN and DstIpAddr are all empty, that row is gone — and the row it deletes most eagerly is the one from the parser with the thinnest telemetry, which is the parser most likely to be watching something nobody has inventoried. Now the service coalesces to UNATTRIBUTED and carries a flag. It is admittedly a row you cannot action as a ticket, since a fix list needs an owner; it is also the row that tells you a 200 came back on /…/heapdump from a service your telemetry can’t name, and that is worth exactly one uncomfortable conversation rather than zero.
Keeping it honest
This one is a hunt and a report, not an alert, and it doesn’t belong in the SOC queue at all. It belongs in a ticket to whoever owns each service:
- It only sees services your web telemetry covers, which is the same coverage limit as Act I and it bites harder here, because absence reads as safety. A service with no proxy logging produces no rows and looks compliant. Pair this with an actual asset inventory, or with an authenticated internal scan, and treat the query output as a floor.
- It only sees endpoints somebody requested. This is inherently a passive discovery method: an exposed
/…/heapdumpthat nobody has ever asked for will not appear. That’s fine forheapdump,env, andconfigprops, which the internet probes constantly, and it’s a real gap for anything unusual. The thirty-day window exists to give background scanning time to do your reconnaissance for you. Serviceis whatever your telemetry calls the destination, andHttpHost,DstFQDN, andDstIpAddrare three different granularities. A shared ingress will collapse many applications into one row; a load-balanced service will fan one application into several. PreferHttpHostwhere it’s populated — it’s the virtual host the client asked for, which is closest to “the application” as an owner would understand it — and check what you’ve actually got before you send anyone a list:_Im_WebSession(starttime=ago(1d)) | summarize count() by HasHost = isnotempty(column_ifexists("HttpHost","")), HasFqdn = isnotempty(column_ifexists("DstFQDN","")).healthandinfoare on the endpoint list on purpose and they are not findings. They’re the two actuator endpoints that are exposed by default and are supposed to be. They’re included so that the base-path recovery works on services where the only thing anyone ever hits is the health check — which is most of them — and they land in P3 at worst. If a P3 list of every health endpoint in the estate is noise for you, filter them at the end, not at the start, or you lose the base paths.- A
200is not always a served endpoint, and a sub-400 is not always a200. Two directions, both handled by the size column rather than by trusting a status. Some WAFs and ingress controllers return200with a block page — so an “exposed” heapdump endpoint whose largest response was 4 KB is a block page, andMaxRespBytestells you that without your having to believe the code. In the other direction, a parser that reports onlyEventResultgives youMaybeServed, which lands in P4 with unverified in the label and is promoted only if the body size corroborates it. When the size itself isUnknown, the row stays in the list rather than being resolved in either direction — same discipline as Act I, and the reasonVerdictsandStatusesare both in the output is so the analyst can see which of these they’re looking at in one glance. - Fixing this is not a detection engineering task and you should hand it over.
management.endpoints.web.exposure.includeis the property that decides what’s mounted; the default ishealthon Spring Boot 3.x andhealth,infoon much of 2.x. Anything else on that list got there deliberately, usually during an incident, usually years ago. The detection’s job is to produce the list. Somebody else’s job is to shorten it.
✨ Bonus: Three-Valued Logic, or Why where not(X) Isn’t the Opposite of where X

Act I turned on a number that might not be there. Last week’s bonus was about order (prev() and serialization); the week before was about membership (leftanti). This week’s is about the thing underneath both of them: what KQL does when it doesn’t know.
where keeps true, and null is not false
KQL comparisons are three-valued. RespBytes > 1048576 evaluates to true, false, or null — and where keeps only the rows where the predicate is true. Null rows are discarded, exactly like false rows, and nothing in the output distinguishes them.
Which produces the result that surprises people:
// These two do NOT partition the table.
| where RespBytes > 1048576         // keeps the big ones
| where not(RespBytes > 1048576)    // keeps the small ones -- and NOT the unknown ones
not(null) is null, not true. So a row with no byte count fails both filters. Run them separately, add up the counts, and you will get fewer rows than you started with — and if you’ve never checked, you have no idea by how much.
This is the mechanism behind Tuesday’s isnotempty(BytesReceived) gate. That clause wasn’t creating the problem; the comparison on the next line would have dropped the same rows anyway. What the explicit guard did was make the deletion look intentional, which is worse, because it reads as care.
The reconciliation that proves it
Before you trust any numeric filter on a field you didn’t populate yourself, make the four populations add up:
let Base = _Im_WebSession(starttime=ago(7d), url_has_any=dynamic(["actuator","heapdump"]))
| extend RespBytes = coalesce(
             column_ifexists("HttpResponseBodyBytes", long(null)),
             column_ifexists("DstBytes", long(null)));
union
    (Base | summarize Rows = count() | extend Population = "All rows"),
    (Base | where RespBytes > 1048576
          | summarize Rows = count() | extend Population = "Above threshold"),
    (Base | where RespBytes <= 1048576
          | summarize Rows = count() | extend Population = "At or below threshold"),
    (Base | where isnull(RespBytes)
          | summarize Rows = count() | extend Population = "NULL - invisible to both"),
    (Base | where RespBytes == 0
          | summarize Rows = count() | extend Population = "Zero - probably also unknown")
| order by Rows desc
Three things to read off it. First, rows one through four must reconcile — All rows equals the sum of the other three. If they don’t, you have a fifth state you haven’t thought about. Second, if NULL is most of the table, your detection isn’t conservative, it’s absent, and the threshold is decoration. Third, look hard at the ratio of Zero to NULL: a parser that never writes null and frequently writes zero is telling you that zero is its null, and any > 0 filter you write is a null filter in disguise.
This is the same habit as last week’s partition-guard check and the week before’s key-cardinality check. Different operator, identical discipline: before you trust a filter, prove it’s discarding what you think it’s discarding.
The four ways a value goes missing, and they need four different tools
| Situation | What you get | Test with | Don’t use |
|---|---|---|---|
| The column doesn’t exist in the schema | Semantic error — query won’t run | column_ifexists("Name", long(null)) |
coalesce(), isnull() |
| Numeric column, no value | Real null |
isnull() |
isempty() |
| String column, no value | Empty string — KQL has no string null | isempty() |
isnull() — always false |
| Value present but unparseable | tolong() returns null |
isnull() after conversion |
trusting the conversion |
The string row is the one that reads as a technicality and isn’t. isnull() on a string column returns false unconditionally, because KQL represents string nulls as empty strings. A clause written where isnull(PrevSubject) doesn’t error and doesn’t warn — it just never fires, and it sits in the query looking exactly like a guard. If you’ve written isnull() against a string anywhere, it isn’t doing anything.
And the conversion row is where the byte-count case actually lands most often. tolong("") is null. tolong("1,048,576") is null, because of the separators. tolong("12 KB") is null. Each of those is a value that a real CEF source has emitted into a numeric-looking field, and each one arrives at your comparison as an unknown wearing a plausible disguise. If the field is a string in your workspace, convert it and then check:
| extend RawBytes = tostring(SentBytes)
| extend Bytes    = tolong(RawBytes)
| extend BytesState = case(
      isempty(RawBytes),  "Absent",
      isnull(Bytes),      "Unparseable",   // and RawBytes tells you what it actually said
                          "Parsed")
| summarize count() by BytesState
Three lines, and the day someone’s connector starts writing "1.2M" you find out from a population shift instead of from a quarter of missed detections.
Aggregations lie in the other direction
summarize treats nulls differently from where, and the difference will bite you at the reporting stage after you’ve handled it correctly at the filtering stage:
count()counts rows, including rows whose values are null.countif(predicate)counts only rows where the predicate istrue— so nulls silently don’t count, same aswhere.max(),min(),avg(),sum()skip nulls.avg()of a column that’s 90% null is the average of the other 10%, reported without comment.sum()of an all-null column is null.dcount()doesn’t count null as a distinct value.
Which is why the Act I summarize carries UnknownSizeHits = countif(Served and SizeVerdict == "Unknown") as a first-class column rather than inferring it from MaxRespBytes being null. The count of what you couldn’t measure is data. Derive it explicitly, put it in the grid, and let the ranking use it.
Classify, then rank — don’t filter
The general form, and the one thing to take from this section:
// Don't do this. It has two states and the data has three.
| where isnotempty(Bytes) and tolong(Bytes) > 1048576

// Do this. Every row survives; the query says what it knows about each one.
| extend Bytes = tolong(column_ifexists("SentBytes", long(null)))
| extend Confidence = case(
      isnull(Bytes),           "Unknown",
      Bytes >= 1048576,        "Confirmed",
                               "Unlikely")
| order by Confidence asc     // Confirmed, then Unknown, then Unlikely
A filter converts uncertainty into absence, and absence is indistinguishable from safety. A classification keeps the uncertainty on screen where somebody has to look at it. The extra cost is one column. The saving is that the first time the field goes missing, you find out from the alert rather than from the incident.
One last note, and it’s a callback: format_bytes() is in these queries for readability and it returns a string. Keep the raw number as its own column. A field you buried in a display string is a field you deleted, with extra steps — you can’t sort it, threshold it, or put it in an order by, and the analyst reads it out of prose instead of a grid.
The Bigger Lesson
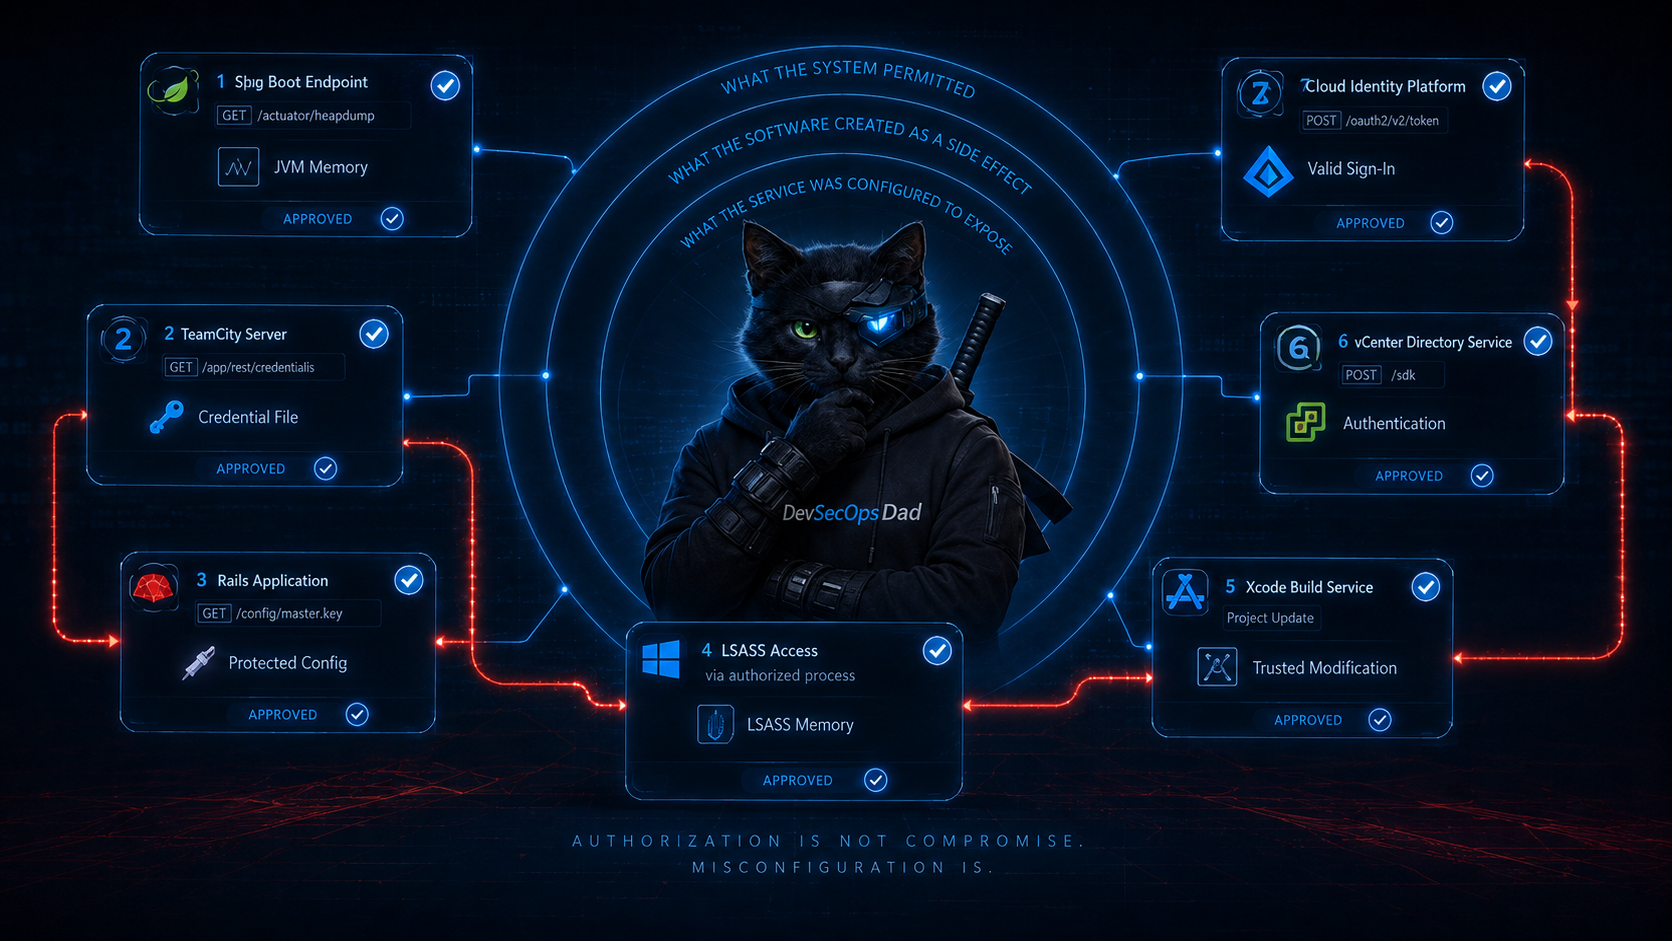
Seven briefs, twenty-eight candidates, and a thread through most of them: nothing was exploited.
- The credential store was an HTTP endpoint. No payload, no injection, no bypass — a documented diagnostics feature that returns the process’s memory as a response body, reachable at a path the operator chose (Act I). When the theft is a legitimate request, the detection has nowhere to look except the size of the answer, the artifact the application left behind, and the fact that the service answered at all.
- The best evidence was the application’s own housekeeping. Not the request, not the response — a temp file that Spring creates because it needs somewhere to put the heap before it streams it, named with a timestamp because the developers needed uniqueness (Act II). That file exists for seconds, tells you an HTTP request happened, and tells you the minute it arrived. Look for the artifact the software created for its own convenience. It’s a habit that keeps paying: last week it was
logAzure.txt, written because the malware authors wanted config persistence. - The rest of the week was the same move at different layers. TeamCity credential files read by an unexpected process. The Rails Active Storage arbitrary file read, where the exploit is an image upload and the payload is
config/master.key. LSASS access alongside a network scan. XCSSET writing into Xcode projects that a developer will compile and sign for it. vCenter’s directory service issuing an authentication it shouldn’t have. Midnight Blizzard signing in. In every one of those, the adversary’s core action was a read that the system was configured to permit. - And the honest structural finding: you cannot detect a read.
DeviceFileEventsdoesn’t emit file-read events, which both Thursday’s and Saturday’s briefs flag in their own blind-spot callouts. Neither does a proxy log tell you what was inside a 400 MB response. Reads are the least instrumented operation in the entire stack, and this week’s adversaries lived in that gap — not because they planned to, but because reading is what you do when the system has already decided to let you.
Last week’s grammar was borrowed infrastructure: the C2 is your calendar, the encryptor is your manage-bde.exe. This week’s is borrowed permission: the request is well-formed, the response is correct, the application behaved exactly as configured. There is no anomaly in the transaction. The anomaly is in the configuration, and configuration is not something a SIEM watches.
Which is why the honorable mention is the query I’d actually run first, even though it’s the least clever one in the article. Acts I and II detect an event that has already happened to a service you may not have known was exposed. The exposure query enumerates the services and hands you a list you can finish. One of those is security operations and the other is just operations, and the week’s evidence is that the second one would have prevented more of this than the first would have caught.
The corrections, collected, because eleven of them landed in one article and most are worth checking in your own content. Five came out of the briefs:
- All three web-tier heapdump candidates hardcode
/actuator/heapdump, and the ISC diary they came from documents scans against/admin-api/actuator/heapdump. The base path is configuration; the endpoint ID is the protocol. (The fourth candidate reads the host rather than the web tier and has a different problem — see number 5.) BytesReceivedis not aCommonSecurityLogcolumn — it’sReceivedBytesandSentBytes— and the brief’s caveat describes the wrong failure mode for it. An absent column is a semantic error, not a null.isnotempty()on the byte count deletes the finding in exactly the environments that need the detection, and the direction ofin/outis undefined relative to the client anyway. Three states, ranked, not two states, filtered.FileName has "heapdump"cannot match a Spring heapdump filename, becauseheapdump2026-08-03-14-49123456.hproftokenizes toheapdump2026andhasis a whole-term test. The clause is dead and theendswithbeside it hides that.- The endpoint does write a file, contrary to Monday’s caveat.
HeapDumpWebEndpointcreates it, the JVM fills it,TemporaryFileSystemResourcedeletes it after the response. That correction is what makes Act II possible at all.
And six of mine, which belong on the page rather than in a commit.
EventResult == "Success"is not a fallback for a status code. The first draft of Act I used it as one, and ASIM defines Success as any status below 400 — so a302to a login page, the signature of a correctly protected endpoint, counted as a served heap dump and could reachP1in the exposure inventory.- An exclusion list built out of a
max(). The first draft of Act II collapsed thirty days of operator diagnostics intomin/maxand then asked a proximity question of the aggregate, which permanently down-ranks every dump on any host running a scheduled JVM diagnostic — three paragraphs after a section promising not to build exclusions. - A dead clause with multi-token needles under
has_any, in the same lane, which is the exact inferred-adjacency mistake this article corrects the briefs for twice. - My prefilter drifted from my endpoint list, under a comment reading “Prefilter terms MUST be the endpoint list itself, not a trimmed cheap subset.” Act I’s omitted
dumpandtrace; the honorable mention’s omittedhealth,infoandmetrics— including the two endpoints a paragraph directly below it says are on the list specifically so base-path recovery works. A prefilter that is not a superset of the authoritative test is a silent narrowing, and a hand-kept parallel copy is a promise, not a mechanism. Both are nowarray_concat(ActuatorEndpoints, …), so the invariant is structural. - Right test, wrong position. The first draft compared the last path segment, which is correct for
heapdumpand wrong for/env/{property},/loggers/{name},/metrics/{name},/health/{component}, and every real Jolokia request — an endpoint I had put on the secret-bearing list and then written a test that could only match its uninteresting form. Position-independentset_intersect()now, with the base path and the selector both falling out as evidence. - Three more unknowns, mishandled three different ways, all in my queries. A
coalesce()that took a literal0from the precise byte column over a real value in the coarse one — an unknown laundered into a measurement. Awhere isnotempty(Service)in the exposure inventory — an unknown deleted by a guard. And acasewhose fall-through filed a500on a live actuator endpoint asOK - not mounted— an unknown reported as safety. Three shapes, one root, and all three sat inside the article that names the root.
Eleven corrections in one article, six of them mine — and the pattern holds from last week, harder than I’d like: the errors didn’t come from not knowing the rules, they came from applying them in one place and not the one next to it. Numbers 9 through 11 were caught in review, after the draft was already arguing all three principles in prose. That is not a comfortable thing to publish and it is the most useful thing in here. If a rule is worth writing down, write it as a mechanism — a derived list, a classification, a column — because a rule you have to remember to apply is a rule you will apply everywhere except the one place it mattered.
And one that isn’t a query bug but is worth naming for anyone running a content pipeline: the same behaviour got two different ATT&CK techniques on two consecutive days. Monday mapped the heapdump work to T1005 Data from Local System. Tuesday mapped it to T1190 Exploit Public-Facing Application. Same endpoint, same source report, same threat, two techniques — which means a coverage map fed by both days has one behaviour reporting coverage in two cells and no way to notice. Neither mapping is unreasonable in isolation. That’s the problem: a plausible mapping and a correct mapping look identical, and nothing downstream ever contradicts either one.
Every one of these came straight out of this week’s daily briefs — each detection shipped with ATT&CK mappings, telemetry requirements, deployment gates, triage runbooks, false-positive notes, and an honest readiness call. Twenty-eight of them this week, and once again the ones I disagreed with were the ones worth writing about.
This kind of detection content is published daily — fresh threat intel translated straight into deployable detections, so you spend your time tuning and shipping instead of reading and re-deriving — that’s the whole point of the Daily Detection Engineering Brief at DevSecOpsDadAttack.com.

Helpful Links and References:
This Week’s Detection Engineering Briefs:
- Monday, 27th July
- Tuesday, 28th July
- Wednesday, 29th July
- Thursday, 30th July
- Friday, 31st July
- Saturday, 1st August
- Sunday, 2nd August
DevSecOpsDadAttack Tags:
- detection-engineering
- kql
- Spring Boot
- Actuator
- heapdump
- Java
- JVM
- ASIM
- Web Session
- CommonSecurityLog
- CEF
- DeviceFileEvents
- column_ifexists
- Three-Valued Logic
- Null Handling
- Attack Surface
- CVE-2026-66066
- CVE-2026-63077
- CVE-2026-59309
- CVE-2026-16232
- T1190
- T1552
- T1005
- Microsoft Sentinel
- Defender XDR
ATT&CK Coverage in This Article:
Detected by the queries above:
- T1190 — Exploit Public-Facing Application (Act I: a request to an exposed management endpoint that returns process memory. The technique covers abuse of internet-facing software weaknesses including misconfiguration, which is what an exposed actuator surface is.)
Present in the activity, not cleanly mappable:
- T1552 — Unsecured Credentials, at the parent level only. The heap contains plaintext database passwords, API keys, tokens, and signing material, and the adversary obtains them without touching an identity system. But read the sub-techniques:
.001 Credentials In Filesdescribes credentials at rest on a filesystem the adversary can already reach;.004 Private Keysis about key material specifically;.007 Container APIis a different plane entirely. None of them describes credentials resident in process memory, served to an unauthenticated caller by the application itself. T1003 OS Credential Dumping is the nearest structural analogue and it is explicitly about operating-system credential material, not application secrets. I’m mapping the parent and declining to force a sub-technique, because forcing one would report coverage of a behaviour the query doesn’t test.
Deliberately unmapped:
- Act II carries no technique. The
.hproffile is written by Spring, not by the adversary. There is no ATT&CK cell for “the application created a temp file while serving a request,” and the nearby candidates are all wrong in the same way: they assert an adversary action that didn’t occur. It is an artifact, not a behaviour — the same call last week’s article made forlogAzure.txtandAzureCommunication.dll, for the same reason. - The honorable mention carries no technique either, and it’s the more interesting case. The tempting mappings are
T1595 Active ScanningorT1592 Gather Victim Host Information, and both are wrong, because the query is not detecting the scanner. It’s inventorying your configuration. The adversary is incidental to it — the same rows appear if the only caller was your own uptime monitor. A configuration finding is not adversary behaviour and does not belong on a coverage map. If yours has nowhere to put “we are exposed,” that’s a gap in the map.
Discussed as a correction, not covered by any query here:
- T1005 vs T1190 on the same behaviour. Monday filed the heapdump work under T1005 Data from Local System; Tuesday filed it under T1190. T1005 is the weaker of the two here — it describes an adversary searching a system they have access to, and in this campaign the adversary has no system access at all, only an HTTP client. Pick one, and prefer T1190 for the access with T1552 alongside for what was taken.
External Sources:
- Johannes B. Ullrich / SANS Internet Storm Center. Java Spring Boot “heapdump” scans. 27 July 2026. https://isc.sans.edu/diary/33188
- Spring Boot Actuator API documentation. Heap Dump (heapdump). https://docs.spring.io/spring-boot/api/rest/actuator/heapdump.html
- Spring Boot API documentation. HeapDumpWebEndpoint. https://docs.spring.io/spring-boot/api/java/org/springframework/boot/actuate/management/HeapDumpWebEndpoint.html
- Microsoft Learn. CEF and CommonSecurityLog field mapping. https://learn.microsoft.com/en-us/azure/sentinel/cef-name-mapping
- Microsoft Learn. The Advanced Security Information Model (ASIM) Web Session normalization schema reference. https://learn.microsoft.com/en-us/azure/sentinel/normalization-schema-web
- Rapid7. KindaRails2Shell: CVE-2026-66066, Critical Arbitrary File Read and Possible Remote Code Execution in Ruby on Rails. https://www.rapid7.com/blog/post/etr-kindarails2shell-cve-2026-66066-critical-arbitrary-file-read-and-possible-remote-code-execution-in-ruby-on-rails
- Microsoft DevBlogs 😼 The Legend of Defender Ninja Cat https://devblogs.microsoft.com/oldnewthing/20160804-00/?p=94025
Stay Ahead of Emerging Threats
Looking for actionable threat intelligence and detection engineering insights?
DevSecOpsDadAttack publishes daily:
📈 Threat Intelligence Briefs focused on active campaigns, exploitation trends, and operational risk
🛠️ Detection Engineering Briefs with ATT&CK mappings, telemetry requirements, KQL detections, tuning guidance, and triage workflows
🔍 Practical analysis designed for SOC teams, threat hunters, detection engineers, and security leaders
Visit DevSecOpsDadAttack.com for the latest intelligence and detection content.

📚 Want to go deeper?
Anyone can aggregate threat intel. Very few teams can prove why they acted—or why they didn’t.
The below books are about closing that gap; turning curated signal into defensible decisions across KQL, PowerShell, and the Microsoft security stack.

🛠️ KQL Toolbox: Turning Logs into Decisions in Microsoft Sentinel

🧰 PowerShell Toolbox: Hands-On Automation for Auditing and Defense

📖 Ultimate Microsoft XDR for Full Spectrum Cyber Defense
Real-world detections, Sentinel, Defender XDR, and Entra ID — end to end.