Introduction and Use Case:
Whether you’re new on the SOC or a seasoned Sentinel Ninja, here are some basic queries I keep coming back to when investigating anything odd about my ingest patterns (and thus my overall cost).
Query Breakdown
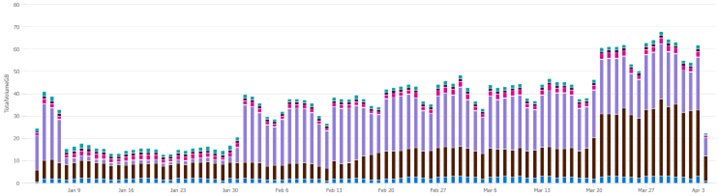
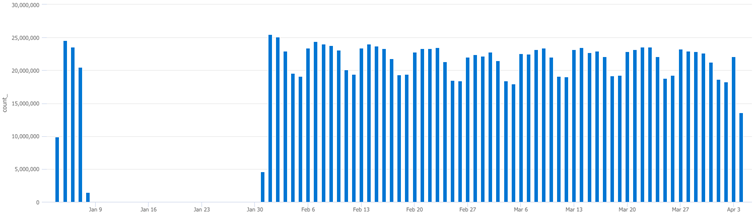
So how do you know something is “odd” with your ingestion volume? I look for sudden changes. Let’s look at the ingest pattern over the past quarter and graph billable volume via the usage table with the following query for a birds-eye view of what’s going on in any environment:
Usage
| where TimeGenerated > ago(90d)
| where IsBillable == true
| summarize TotalVolumeGB = sum(Quantity) / 1000 by bin(StartTime, 1d), Solution
| render columnchart
How does one construct such a handy query from scratch? Let’s break it apart line by line:
Usage                               // <--tells us which table to apply this query to. In this case it's the Usage log table.

| where TimeGenerated > ago(90d)   // <-- how far back the query will look in the table

| where IsBillable == true          // <-- filters out non-billable data (we're only worried about data that incurs a cost)

| summarize TotalVolumeGB = sum(Quantity) / 1000 by bin(StartTime, 1d), Solution    // <--Convert to GB and return results by day, per ingest solution (LogManagement, Security, etc.)

| render columnchart                // <-- graph results to a column chart
How Verbose is a Table?
AzureDiagnostics        // <--Define the table to query
| summarize count() by bin(TimeGenerated,1d)    // <--Return count per day
| render columnchart        // <--Graph a column chart
Notes:
-
By changing Line 1, you can run the query against different tables without re-writing the entire query
-
Notice that compared to the previous query, the time frame isn’t specified. This was done in the GUI with a custom range as follows:
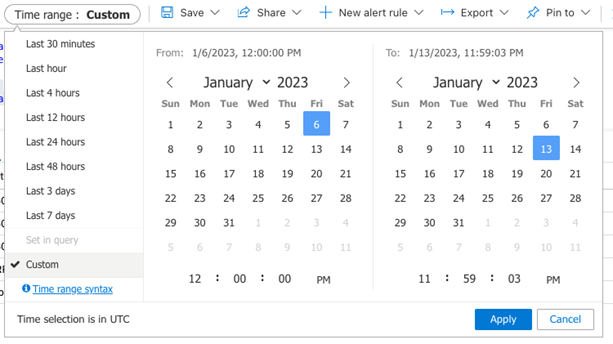
Results:
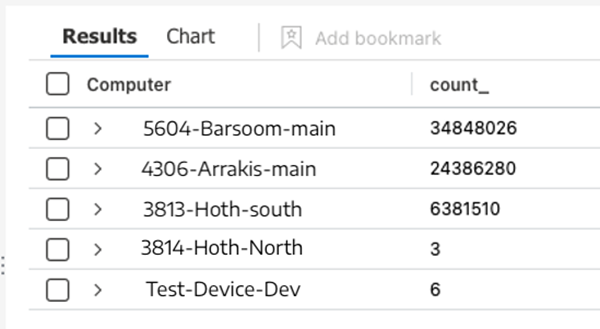
Syslog Activity by Device:
Syslog      // <--Define the table to query (Syslog)
| summarize count() by Computer     // <--Return Syslog count per computer
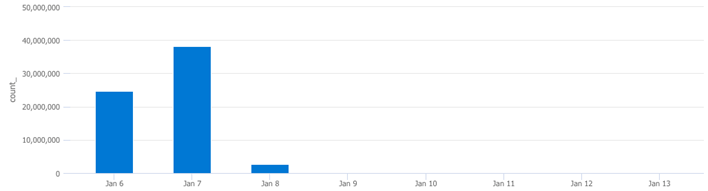
Syslog Activity per Day from a Specific Device:
Syslog      // <--Define the table to query (Syslog)
| where TimeGenerated > ago(90d)      // <-- how far back to query the table
| where Computer == "5604-Barsoom-main"         // <--Query a specific device
| summarize count() by bin(TimeGenerated,1d)    // <--Return count per day
| render columnchart     // <--Graph results to chart
Summary:
In this post, we broke down some helpful, basic KQL queries and syntax:
- Defining table to query against
- Defining time periods manually and via GUI
- Filtering out non-billable query results
- Leveraged the Summarize function to manipulate results
- Graphing results to chart
- Querying specific devices
- Querying the Usage table for anomalies
📚 Want to go deeper?
My Toolbox books turn real Microsoft security telemetry into defensible operations:

🧰 PowerShell Toolbox Hands-On Automation for Auditing and Defense

🛠️ KQL Toolbox: Turning Logs into Decisions in Microsoft Sentinel

📖 Ultimate Microsoft XDR for Full Spectrum Cyber Defense
Real-world detections, Sentinel, Defender XDR, and Entra ID — end to end.
Official Microsoft References:
- https://learn.microsoft.com/en-us/azure/data-explorer/kusto/query/
- https://learn.microsoft.com/en-us/azure/data-explorer/kql-quick-reference
- https://learn.microsoft.com/en-us/azure/data-explorer/kusto/query/tutorials/use-aggregation-functions
- https://learn.microsoft.com/en-us/azure/data-explorer/kusto/query/best-practices