Introduction and Use Case:
Continuing from a previous post, today we’ll dissect even more simple but powerful KQL queries that are essential to keep in your threat hunting utility belt.
Recap:
In my last post, we broke down some helpful, basic KQL queries and syntax:
- Defining table to query against
- Defining time periods manually and via GUI
- Filtering out non-billable query results
- Leveraged the Summarize function to manipulate results
- Graphing results to chart
- Querying specific devices
- Querying the Usage table for anomalies
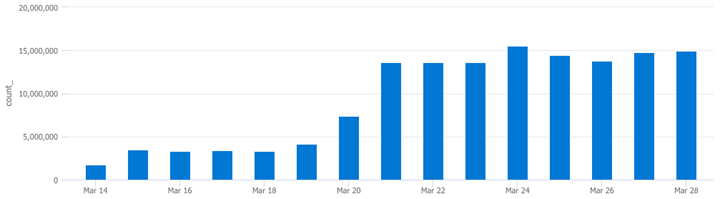
How verbose is an EventID?
SecurityEvent // <--Define the table to query

| where EventID == "4663" // <--Query for specific EventID

| summarize count() by bin(TimeGenerated,1d) // <--Return count per day

| render columnchart // <--Graph a column chart
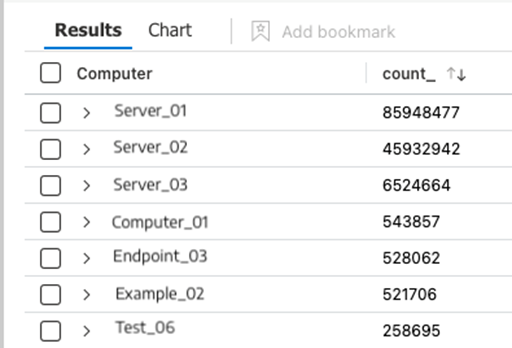
Which Devices are Throwing a Specific EventID?
SecurityEvent // <--Define the table to query

| where EventID == "4663"   // <--Query for specific EventID

| summarize count() by Computer // <--Return count per computer
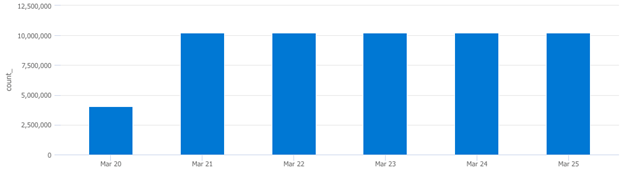
How often does a specific computer throw a specific EventID over a defined timespan?
SecurityEvent   // <--Define the table to query

| where EventID == "4663"   // <--Query for specific EventID

| where Computer == "This Guy" // <--Query a specific device

| summarize count() by bin(TimeGenerated,1d) // <--Return count per day

| render columnchart // <--Graph results to chart
Summary:
In this post, we broke down some helpful, basic KQL queries and syntax:
- Defining table to query against
- Querying for specific EventIDs
- Querying specific devices
- Combining these to query for specific EventIDs on specific devices
- Leveraged the Summarize function to manipulate data (break totals up by day etc.)
- Graphing results to chart
📚 Want to go deeper?
My Toolbox books turn real Microsoft security telemetry into defensible operations:
🧰 PowerShell Toolbox Hands-On Automation for Auditing and Defense
🛠️ KQL Toolbox: Turning Logs into Decisions in Microsoft Sentinel
📖 Ultimate Microsoft XDR for Full Spectrum Cyber Defense
Real-world detections, Sentinel, Defender XDR, and Entra ID — end to end.
Official Microsoft References:
- https://learn.microsoft.com/en-us/azure/data-explorer/kusto/query/
- https://learn.microsoft.com/en-us/azure/data-explorer/kql-quick-reference
- https://learn.microsoft.com/en-us/azure/data-explorer/kusto/query/best-practices
- https://learn.microsoft.com/en-us/azure/data-explorer/kusto/query/tutorials/use-aggregation-functions