Recap:
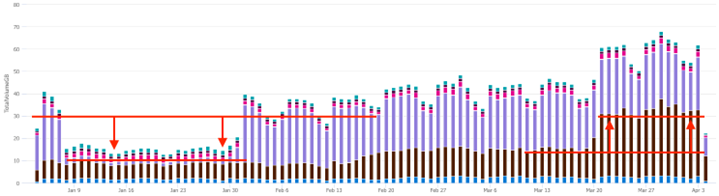
In my last post, we leveraged the awesome power of KQL to investigate the drop in billable LogManagement ingest volume illustrated below (left side). During this investigation, we noticed a sudden increase in Security ingest volume toward the end of March. In this post, we’re going to track down the root cause of this sudden increase.
KQL query to generate the chart referenced above:
Usage
| where TimeGenerated > ago(90d)
| where IsBillable == true
| summarize TotalVolumeGB = sum(Quantity) / 1000 by bin(StartTime, 1d), Solution
| render columnchart
Where did additional Security ingest volume come from in March?
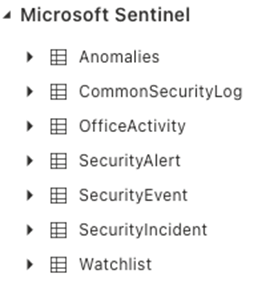
The security tables can be viewed in the UI from the Sentinel workspace (expand the Microsoft Sentinel drop-down to see them, shown below. Something in one or more of these Security tables has changed and is responsible for the sudden increase in ingest volume in March.
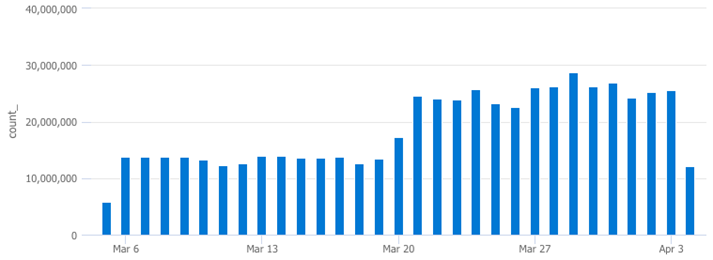
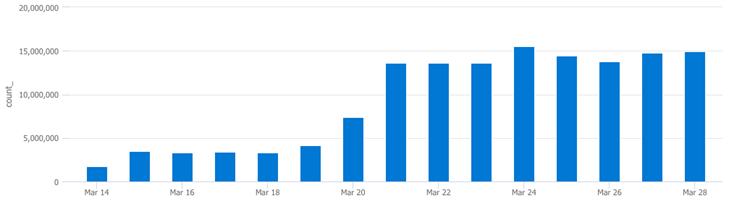
After checking the SecurityAlert, SecurityEvent, and SecurityIncident tables, the SecurityEvent table returned a matching pattern in ingestion volume, illustrated below.
SecurityEvent
| where TimeGenerated > ago(30d)
| summarize count() by bin(TimeGenerated,1d)
| render columnchart
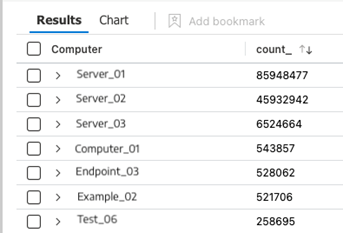
The next step is to see which EventIDs have started to fire more frequently and why.
This query summarizes the results by EventID and their count (number of times they’ve fired):
SecurityEvent
| where TimeGenerated > ago(30d)
| summarize count() by EventID
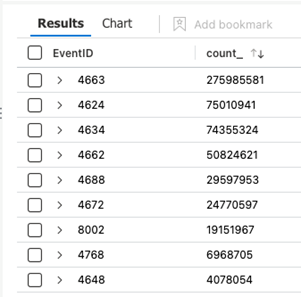
Sort the results by the “count_” column to see the most frequently occurring events (pictured above).
The outlier here is EventID 4663, lets run a query to see the volume over time for this event:
SecurityEvent
| where EventID == "4663"
| summarize count() by bin(TimeGenerated,1d)
| render columnchart
The results above look like the security volume pattern we noticed in the Usage table earlier.
This next query shows which machines are throwing EventID 4663 so we can try to identify where the source of increased ingest volume is coming from:
SecurityEvent
| where EventID == "4663"
| summarize count() by Computer
If we graph this by clicking on the “Chart” button in the UI (shown below) we can see 2 major outliers:
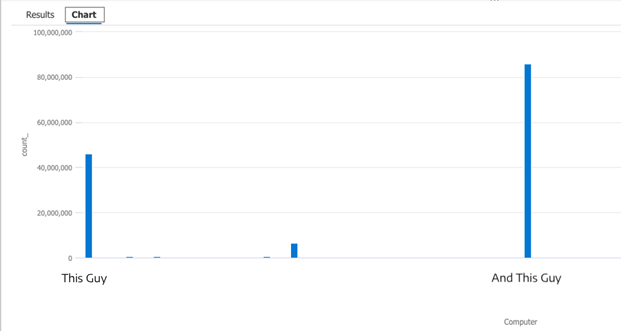
Plugging these outliers into the next query will graph how many times each machine has triggered this event ID:
SecurityEvent
| where EventID == "4663"
| where Computer == "This Guy"
| summarize count() by bin(TimeGenerated,1d)
| render columnchart
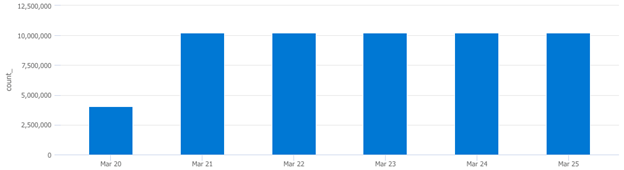
Plugging in the other outlier’s FQDN returned the same trend. These two machines are responsible for a significant increase in ingest volume because they have started triggering EventID 4663 more frequently since March 21st. At this time, we need to notify the administrator and inquire about any changes involving these two machines from this time period. My best guess is that they were spun up on March 20th and configured differently when compared to other machines in the environment, something they will want to know about.
Summary
In this post, we:
- Graphed the last 90 days of billable ingest cost
- Identified a sudden increase in billable ingest volume
- Identified the Logging Solution (Security)
- Identified the specific Table
- Identified the EventID
- Identified the Device(s)
- Identified the exact time frame
📚 Want to go deeper?
My Toolbox books turn real Microsoft security telemetry into defensible operations:

🧰 PowerShell Toolbox Hands-On Automation for Auditing and Defense
🛠️ KQL Toolbox: Turning Logs into Decisions in Microsoft Sentinel

📖 Ultimate Microsoft XDR for Full Spectrum Cyber Defense
Real-world detections, Sentinel, Defender XDR, and Entra ID — end to end.