Introduction and Use Case:
You have recently deployed Microsoft Defender for Endpoint. Before this, your workstations were reporting directly to Sentinel. Now that your workstations have 30 days of retention in the Defender for Endpoint product, why duplicate those workstation logs into your Sentienl ingest volume and pay twice? From a Defense in Depth perspective, that’s nice to have the added layer, however that’s not always practical. For added complexity, your Sentinel and Log Analytics Workspace commitment tiers are different/don’t match up.
What should you do?
1. Identify deployment region for both Sentinel and Log Analytics Workspace (LAW)
2. Identify the Sentinel and Log Analytics Workspace **Commitment Tiers**
3. Calculate Effective per GB rates
4. Leverage KQL to query for workstations logging directly to Sentinel 5. **Join** results to another query against a different table
5. Plug Rates into KQL Query to Calculate Cost
1. Identify Deployment Region for Workspace
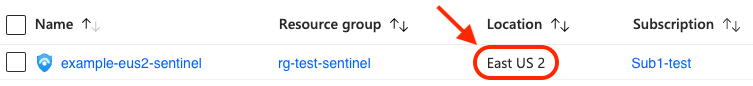
_Take note of the location, we’ll need it later_
2. Identify Commitment Tiers
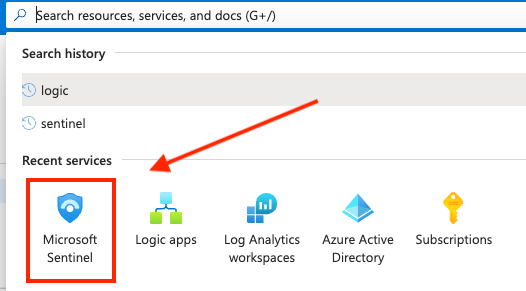
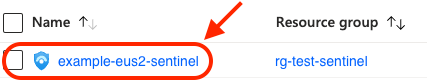
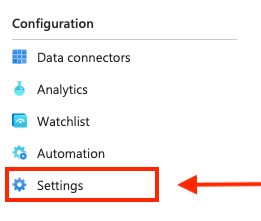
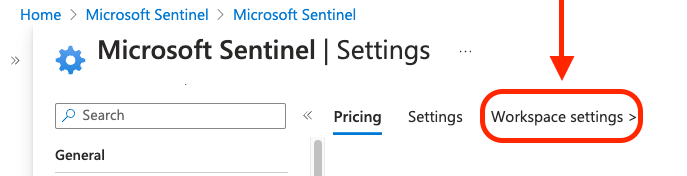
To determine your Sentinel commitment tier, search “Sentinel” in the top navbar then select your workspace and click on the Settings blade, illustrated in the following screenshots:
_Note:_ Shortcut to LAW from Settings blade in Sentinel: To skip searching for LAW in the navbar and several subsequent clicks to get to the same place. While in Sentinel, you can quickly swith to LAW using this shortcut in the Settings blade:
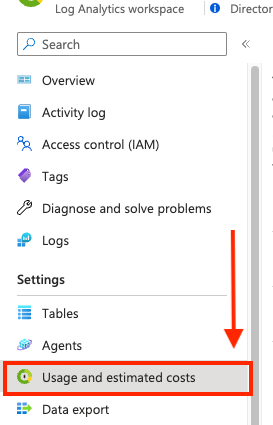
Then you can go directly to the Usage and estimated costs blade:
3. Calculate Effective Per GB Rates
In this example where Sentinel is set to Pay-as-you-go and LAW is set to 100GB / day, the effective per GB rate is $3.96
Log Analytics Workspace:
($196/day) % (100GB/day) = ($196 % 100GB) = $1.96 / GB
All we have to do next is combine this with the Sentinel cost per GB for a total Effective Per GB Price:
Sentinel ($2.00/GB) + LAW ($1.96) = Effective Per GB Price ($3.96)
4. Query for Workstations
Heartbeat                                                                       //<-- Query the Heartbeat table
| where OSName contains "Windows 10" or OSName contains "Windows 11"            //<-- Query for Win10 and 11 Workstations
| where TimeGenerated >ago(30d)                                                 //<-- Query the last 30 days
| summarize arg_max(TimeGenerated, OSName) by Computer                          //<-- Summarize by computer
5. Join Results to SecurityEvent Query
Heartbeat
| where OSName contains "Windows 10" or OSName contains "Windows 11"
| where TimeGenerated >ago(30d)
| summarize arg_max(TimeGenerated, OSName) by Computer
| join (SecurityEvent                                                           //<-- Join results with the following query against the SecurityEvent table
| where TimeGenerated >ago(30d)) on Computer                                    //<-- Query the last 30 days
| summarize GB=sum(_BilledSize)/1000/1000/1000                                  //<-- Summarize by total _Billed Size and convert to GB
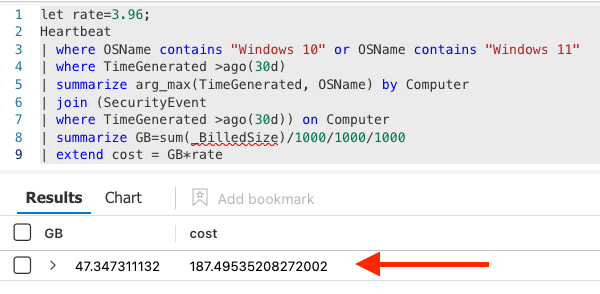
6. Plug in Effective Per GB Rate
let rate=3.96;                                                                  //<-- Plug in Effective per GB Rate Here)
Heartbeat
| where OSName contains "Windows 10" or OSName contains "Windows 11"
| where TimeGenerated >ago(30d)
| summarize arg_max(TimeGenerated, OSName) by Computer
| join (SecurityEvent
| where TimeGenerated >ago(30d)) on Computer
| summarize GB=sum(_BilledSize)/1000/1000/1000
| extend cost = GB*rate                                                         //<-- Multiply total GB by the effective per GB rate
Summary:
In this exercise, we identified the region and commitment tiers for our environment in order to calculate the effective per GB price and plug it into a KQL query to see exactly how much duplicate cost these workstations logging to Defender and Sentinel were running up.
📚 Want to go deeper?
My Toolbox books turn real Microsoft security telemetry into defensible operations:
🧰 PowerShell Toolbox Hands-On Automation for Auditing and Defense
🛠️ KQL Toolbox: Turning Logs into Decisions in Microsoft Sentinel
📖 Ultimate Microsoft XDR for Full Spectrum Cyber Defense
Real-world detections, Sentinel, Defender XDR, and Entra ID — end to end.
Resources:
- https://github.com/EEN421/KQL-Queries
- https://github.com/rod-trent/MustLearnKQL
- https://learn.microsoft.com/en-us/sharepoint/dev/general-development/keyword-query-language-kql-syntax-reference
- https://techcommunity.microsoft.com/t5/microsoft-sentinel-blog/become-a-microsoft-sentinel-ninja-the-complete-level-400/ba-p/1246310