What Went Down?
The following KQL query is great for checking out your billable ingest patterns over the past quarter for Quarterly Business Reports and stuff. In this scenario, you run this query and discover a significant drop in billable ingest volume for a couple of weeks. You’re delivering the QBR tomorrow, what do you do? Put on your detective hat and give that magnifying glass a quick wipe with a microfibre cloth and lets investigate.
Identify the Crime…
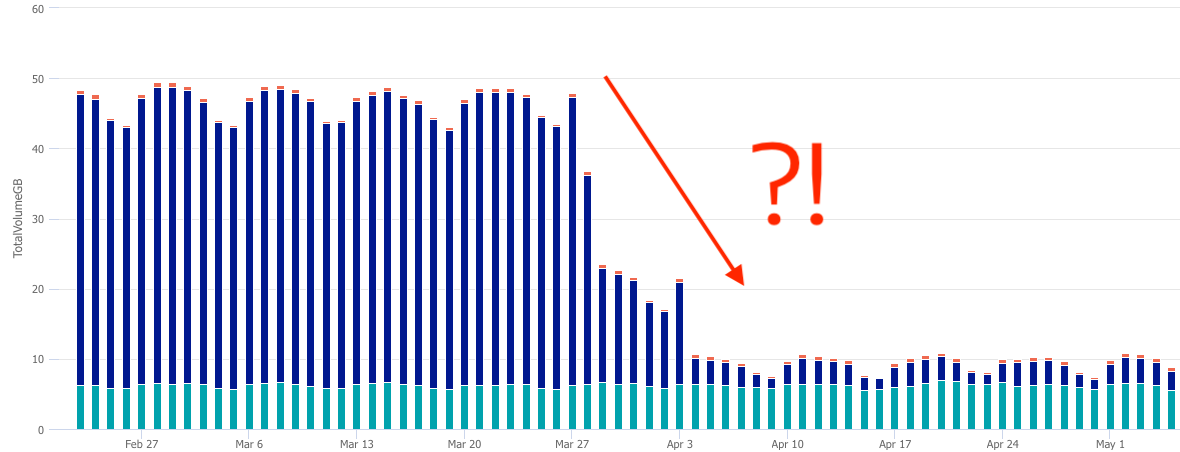
This KQL query is my go-to for quickly visualizing issues/trends:
Usage                                                     // <--Query the Usage table
| where TimeGenerated > ago(90d)                          // <--Query the last 90 days
| where IsBillable == true                                // <--Only include 'billable' date
| summarize TotalVolumeGB = sum(Quantity) / 1000 by bin(StartTime, 1d), Solution // <--Chop it up into GB per Day
| render columnchart                                      // <--Graph the results
The results reveal the scene of the crime…
Saboteur!
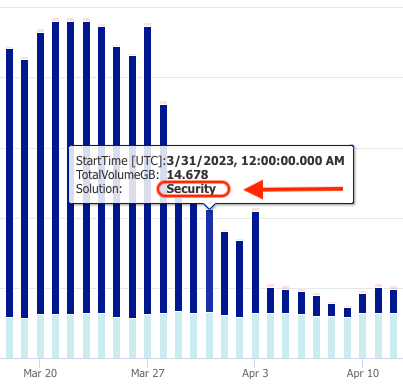
The crime we’re investigating today, is the take down (abeit temporary) of mission critical systems. To determine ‘source’ of the drop off, hover the mouse over the dark blue sections of the column graph:
Identify the Suspects…
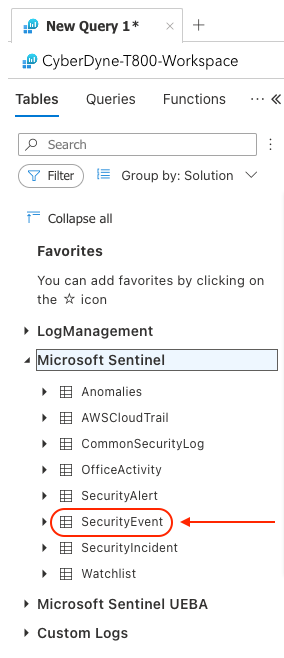
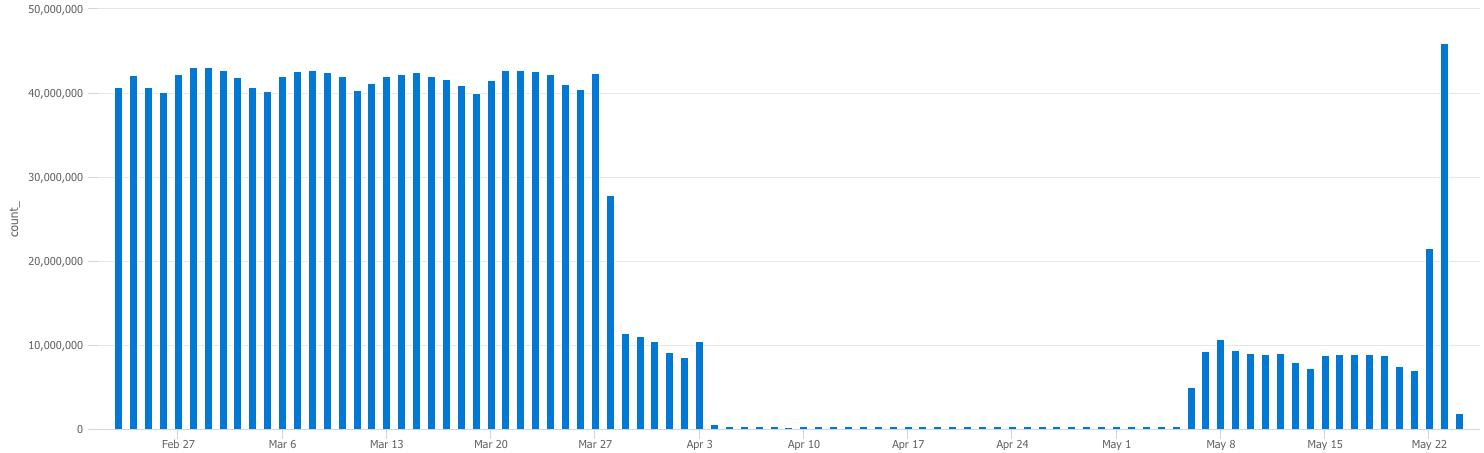
The results of this next Query show us that the SecurityEvent table specifically is what contributed to the overall outage. We arrived at this by cycling the first line of the query through the available tables under “Microsoft Sentinel” (which is comprised mainly of log sources that make up the “Security” solution from the previous queries) until we found a match to account for the drop in ingest volume:
SecurityEvent                                           // <--Define the table to query
| where TimeGenerated > ago(90d)                        // <--Query the last 90 days into the table
| summarize count() by bin(TimeGenerated,1d)            // <--Return count per day
| render columnchart                                    // <--Graph a column chart
Innocent, Until Proven Guilty…
This is the same query as above, but with the dates set in the GUI to when the outage occurred. There is also an extra parameter at the end of the summarize line to show us the count per day, but this time by computer as well. This will help us narrow down which devices went offline and which ones remained online during the “outage”:
SecurityEvent
| summarize count() by bin(TimeGenerated,1d), Computer	   // <--Summarize count per computer per day
| render columnchart                                       // <--Graph the results
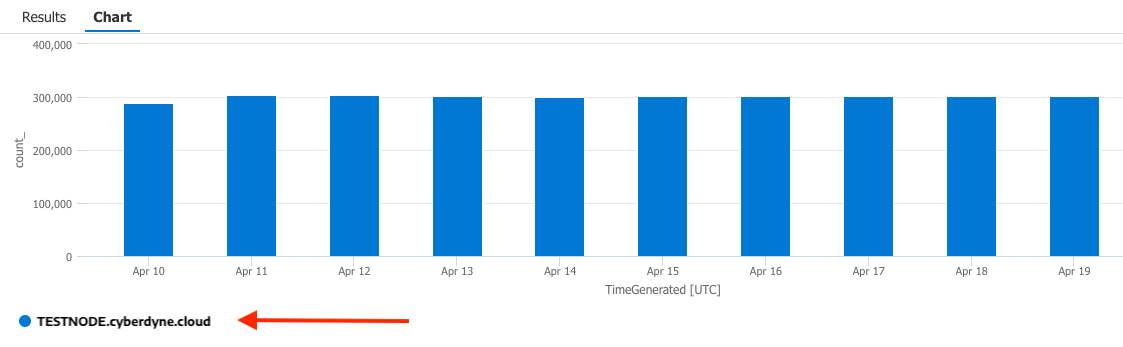
NOTE: The only machine that remained online while everything else went offline, was TESTNODE.cyberdyne.cloud…illustrated below:
Judgement…
This next Query returns all computers that reported in before, during, and after the outage.
SecurityEvent                                   // <--Define the table to query
| where TimeGenerated > ago(90d)                // <--Query the last 90 days into the table
| summarize count() by Computer                 // <--Summarize Count by Computer
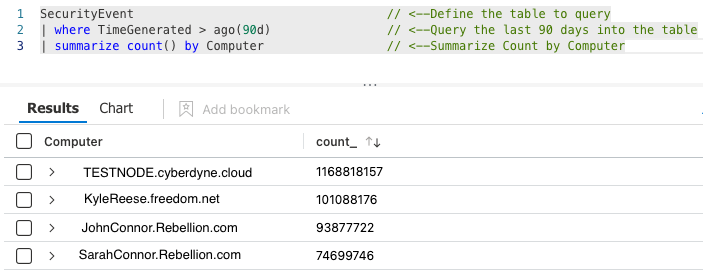
The entire network went offline, except TESTNODE.cyberdyne.cloud, for a brief period back in April.
Someone should get with Cyberdyne DevSecOps about this before this thing goes rogue…
📚 Want to go deeper?
My Toolbox books turn real Microsoft security telemetry into defensible operations:

🧰 PowerShell Toolbox Hands-On Automation for Auditing and Defense

🛠️ KQL Toolbox: Turning Logs into Decisions in Microsoft Sentinel

📖 Ultimate Microsoft XDR for Full Spectrum Cyber Defense
Real-world detections, Sentinel, Defender XDR, and Entra ID — end to end.
Resources: