Introduction and Use Case:
You’re an industrial manufacturing plant manager, you need to prototype, deploy, secure, and remotely manage connected electronic devices at scale. You need to be practical and most importantly, cost-effective. Thankfully, you’ve made good decisions up to this point and have invested in a SIEM such as Azure Sentinel (good job!).
👉 Most of your sensor and PLC equipment connects through an API or is compatible with the Azure Monitoring Agent. What do you do for your unsupported but critical IoT architecture?
💡 In my experience, typically some custom hardware running some flavour of Linux under the hood, think Raspberry Pi based microcontrollers that help automate the line for example.
In this post we will:
- Call out and solve for use-case pre-requisites
- Configure our ‘unsupported’ equipment accordingly (Ruby & FluentD)
- Create a Log Analytics Workspace
- Retrieve WorkspaceID and Primary Key
- Program the config file for log aggregation (FluentD)
- Log auth and syslog tables to a Log Analytics Workspace
Call out and solve for pre-requisites
Typically, the easiest way to send logs to Log Analytics workspace is to leverage the Microsoft OMS Agent. Microsoft supports Linux and has an OMS agent available but doesn’t support popular ARM platforms like a Raspberry Pi build. Our setup will rely on Ruby and FluentD to talk to the Log Analytics Workspace
Configure our ‘unsupported’ equipment
- Install Ruby
sudo aptitude install ruby-dev
- Check/Confirm Ruby Version:
ruby -ver
- Install FluentD Unified Log Aggregator & Plugin
sudo gem install fluentd -v "~> 0.12.0"
sudo fluent-gem install fluent-plugin-td
- Install FluentD Plugn for Azure Log Analytics
sudo fluent-gem install fluent-plugin-azure-loganalytics
Create a Log Analytics Workspace
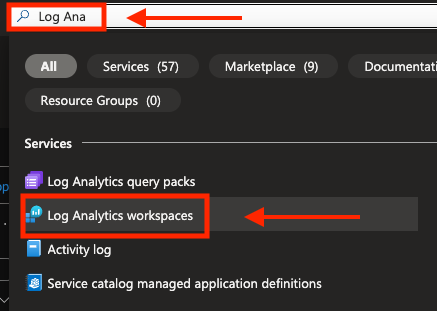
- Navigate to Log Analytics Workspace in Azure Portal:
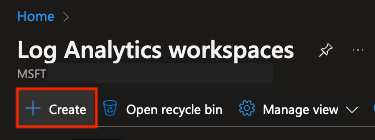
- Select +Create
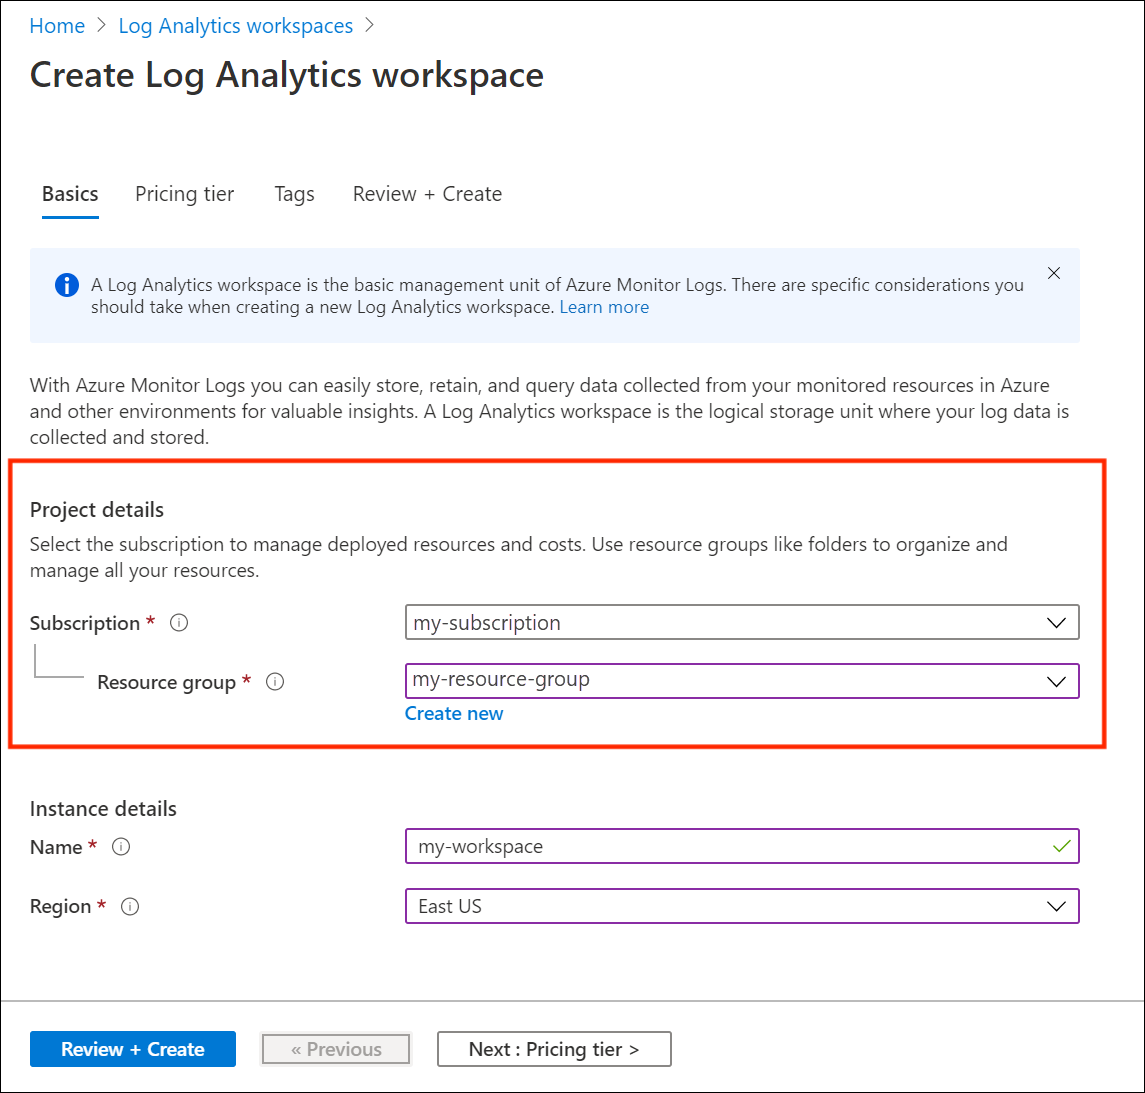
- Select Subscription and Resource Group:
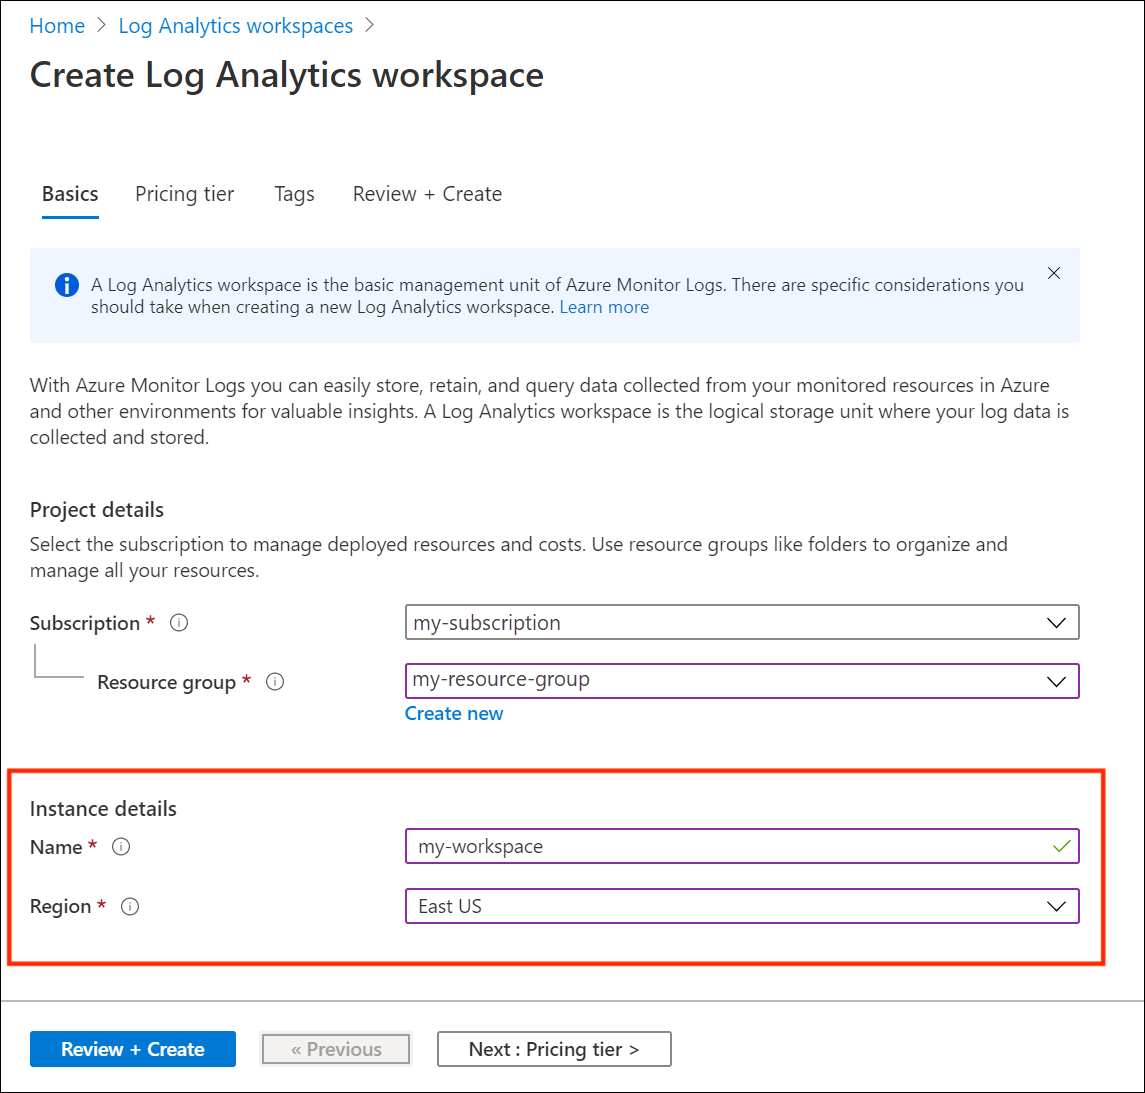
- Select Instance Name and Region:
- Pricing Tier:
Choose the appropriate commitment tier given your expected daily ingest volume.
💡 👉 I like to see roughly 15% more ingest than required for the next pricing tier to insulate against nights, weekends, and holidays which inherently drag down the daily ingest volume average.
- Click Review & Create to finish setting up a new Log Analytics Workspace
Retrieve WorkspaceID and Primary Key
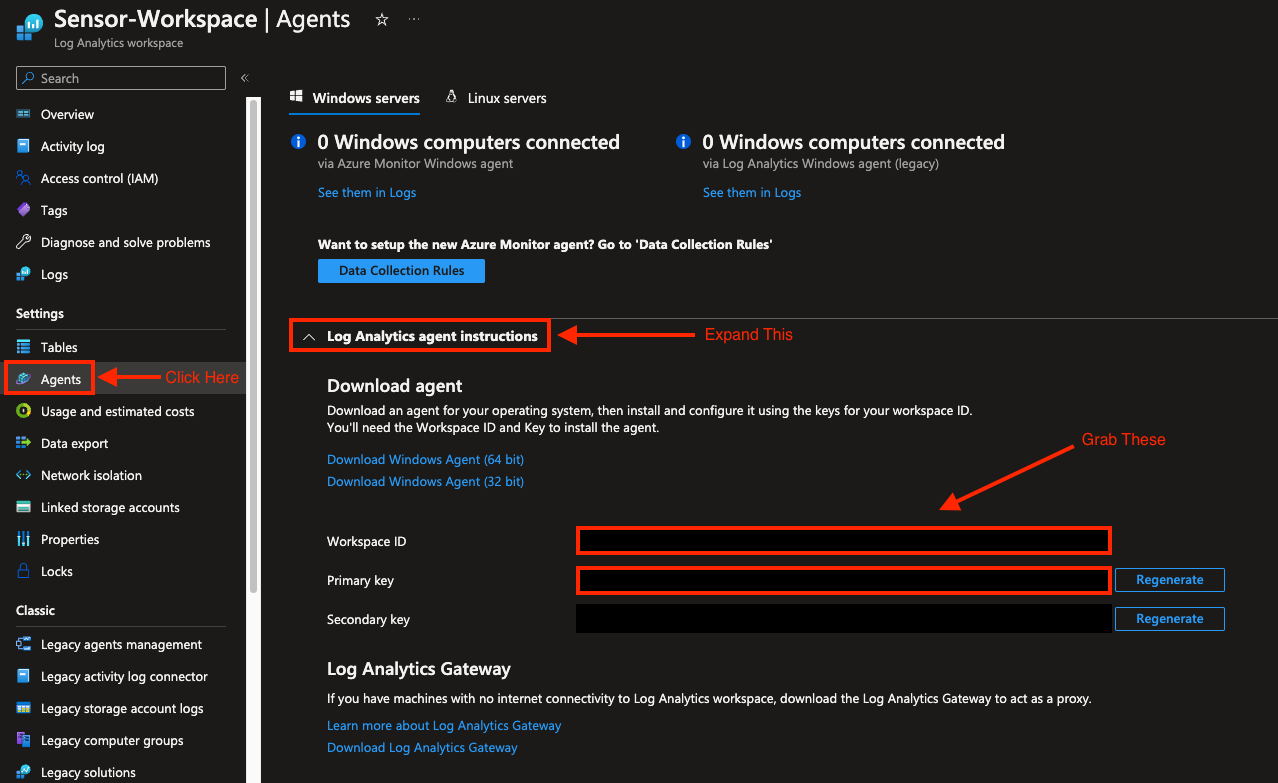
Build a Configuration File for FluentD
-
Swap out the WorkspaceID and Primary Key in this fluent.conf file with the values we acquired in the previous step.
-
Run the following command to start logging to your Log Analytics Workspace:
sudo fluentd -c /etc/fluent.conf --log /var/log/td-agent/fluent.log
Lets break down the above command, there’s a lot going on here:
sudo fluentd #<-- starts fluentd with super user privileges

-c /etc/fluent.conf #<-- the '-c' switch tells us where to look for the config file (I keep mine in /etc/)

--log /var/log/td-agent/fluent.log #<-- the '--log' switch enables verbose logging and specifies where to drop the resulting log output
💡 Pro-Tip: save the command to start logging to your workspace as a .bash command so you don’t have to re-enter the lengthy paramters every time. Run the following commands to do this:
sudo nano start.bash #<-- opens nano text editor and creates file 'start.bash'Paste the entire start command and parameters and press:
CTRL+X followed by 'Y' then Enter to saveNow to run the start command, all you have to do is:
sudo start.bash
💡 Another Pro-Tip: 👉 Create a CRON job to start logging on startup
Query Auth and Syslog Tables
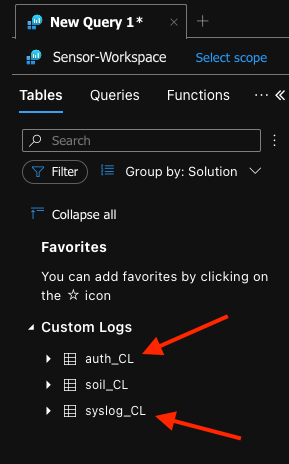
Navigate to your Log Analytics Workspace and you should see your custom logs (logs ingested this way show up under ‘Custom Logs’ and have ‘_CL’ appended to their name when they hit the workspace, illusgtrated below):
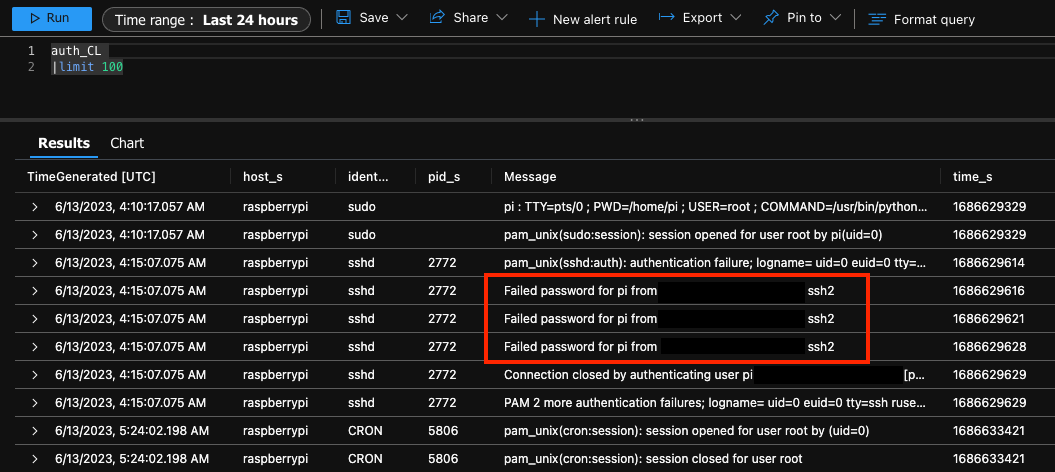
💡 Once FluentD is cooking without issue on your Pi, try logging in with an incorrect password to trigger an entry in the new custom log ‘auth_cl’ then query the table 👇
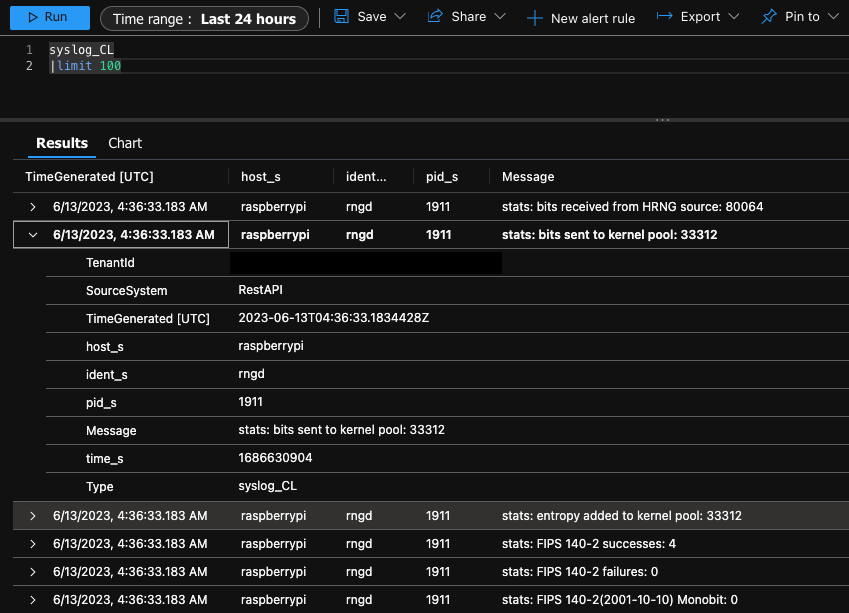
The syslog table (syslog_cl) is populating too 👇
In this, post we:
- ✓ Called out and solved for use-case pre-requisites
- ✓ Configured our ARM equipment accordingly (Ruby & FluentD)
- ✓ Create a Log Analytics Workspace
- ✓ Retrieve WorkspaceID and Primary Key
- ✓ Program the config file for log aggregation (FluentD)
- ✓ Log auth and syslog tables to a Log Analytics Workspace
📚 Want to go deeper?
My Toolbox books turn real Microsoft security telemetry into defensible operations:
🧰 PowerShell Toolbox Hands-On Automation for Auditing and Defense
🛠️ KQL Toolbox: Turning Logs into Decisions in Microsoft Sentinel

📖 Ultimate Microsoft XDR for Full Spectrum Cyber Defense
Real-world detections, Sentinel, Defender XDR, and Entra ID — end to end.
Resources:
- FluentD Cloud Data Logging (Raspberry Pi)
- FluentD configuration file syntax
- Create a Log Analytics Workspace - Official Microsoft Documentation
