Introduction and Use Case:
Microsoft Sentinel is a powerful tool that enables security teams to detect, investigate, and respond to threats across their entire organization. However, when it comes to presenting this data to clients, it can be challenging to make sense of the raw data, and it can take time to manually query the data you might need.
This is where PowerBI comes in: a business analytics service that provides interactive visualizations and business intelligence capabilities with an interface simple enough for end users to create their own reports and dashboards. In this post, we will explore how to automate a custom ingest usage trend report, delivering added value while saving time and streamlining your reporting process 🤑
In this Post We Will:
- 👉Define our report and the underlying KQL
- 👉Run and export our KQL to a PowerBI M Query
- 👉Import our M Query into PowerBI
- 👉Manipulate Data Sets and Render Visuals
- 👉Save and Export our Report to PDF
- 👉Re-run our report with 1-click!
- 👉Achieve Awesome-ness 😎
Pre-Requisites:
Define our Report and the Underlying KQL:
Lets keep it simple and report on our Ingest tends for this exercise and query the Usage table; Everybody’s got a Usage table right? Depending on what you’ve got in your environment, maybe you could involve firewall logs via the commonsecuritylog or syslog tables for quarterly security meetings etc. You’re only limited to what’s in your workspace!
In my experience, usage and cost trends are almost always brought up during quarterly business reviews. You could manually query your workspace for this infor every quarter and paste the results into a PowerPoint deck or whatever, but that’s not optimial… Let’s automate this!
👉 For this report, lets include ingest trends from the Usage table for the past 90, 60, 30, and 7 days. You can copy and paste the KQL from my GitHub repo here: 90 Day Billable Ingest Volume.kql
💡 Pro Tip: Check out my full catalogue of useful KQL queries ready to copy and paste here: EEN421/KQL-Queries: Ian’s deceptively simple KQL queries for solving complicated conundrums
Run and export our KQL to a PowerBI M Query
1 - Fire up your favourite browser, navigate to the Azure portal and load your Log Analytics Workspace of choice.
2 - Paste the 90 Day Billable Ingest Volume.kql query into the query window and run it.
3 - Once the query has finished running, the –> Export button will become available. Click on it and select PowerBI (as an M query), illustrated below.
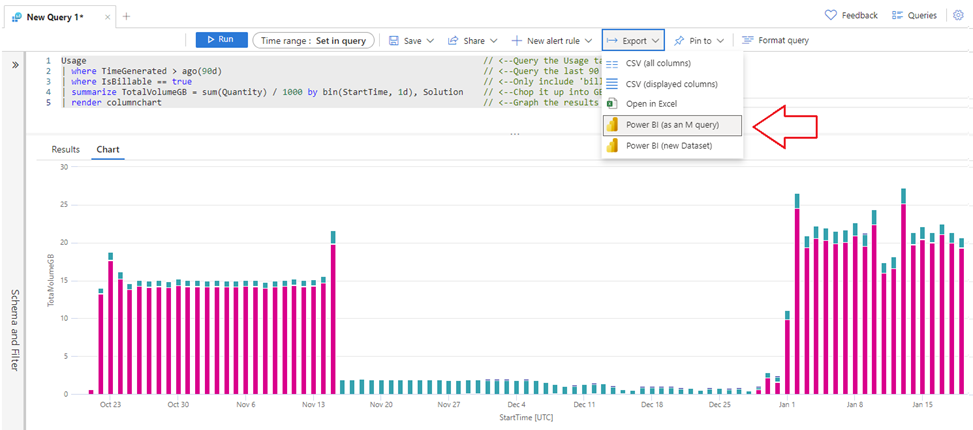
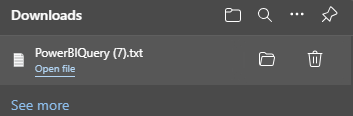
4 - A PowerBIQuery.txt file will populate in your Downloads folder. Hang onto this❗
Import our M Query into PowerBI:
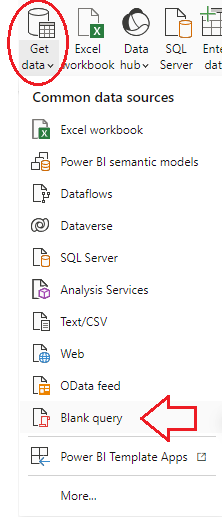
1 - Spin up the PowerBI Desktop App (PowerBI WebApp does NOT support importing M Queries) and make sure you’re signed into PowerBI with an account that has the Security Reader RBAC role and go to Home > Get data > Blank Query.
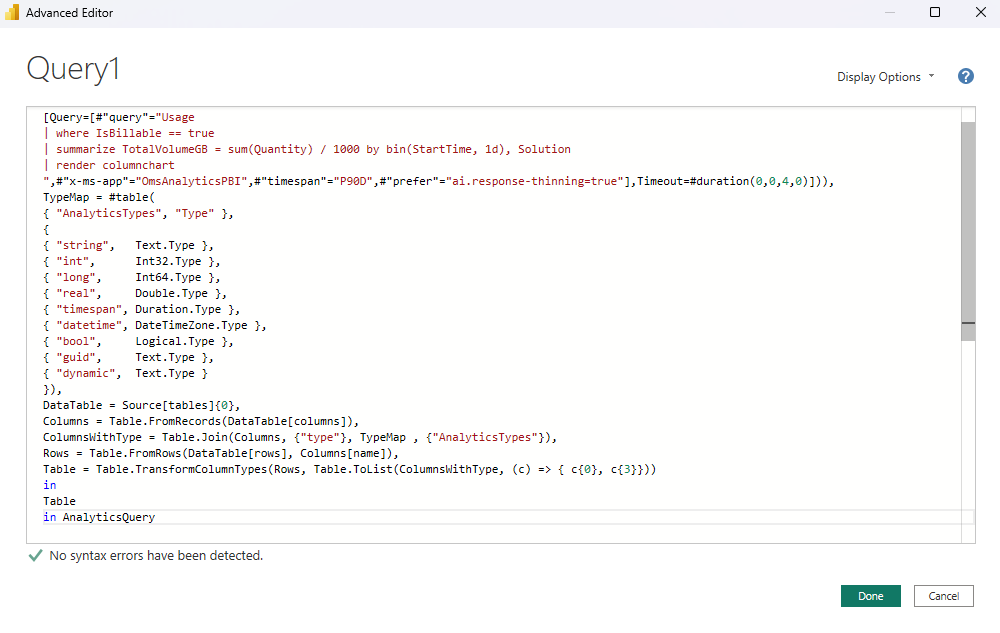
2 - A new window will pop up. Select Advanced Editor (shown below).
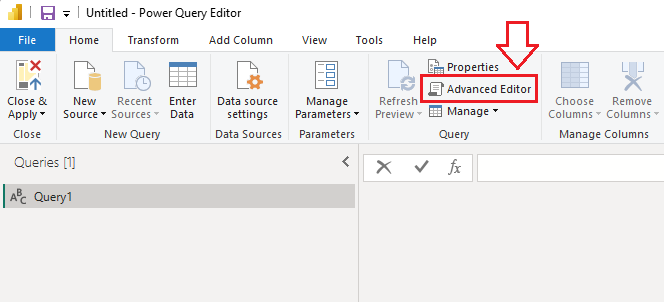
3 - Paste the contents of the PowerBIQuery.txt from earlier into the Advanced Editor and click on Done
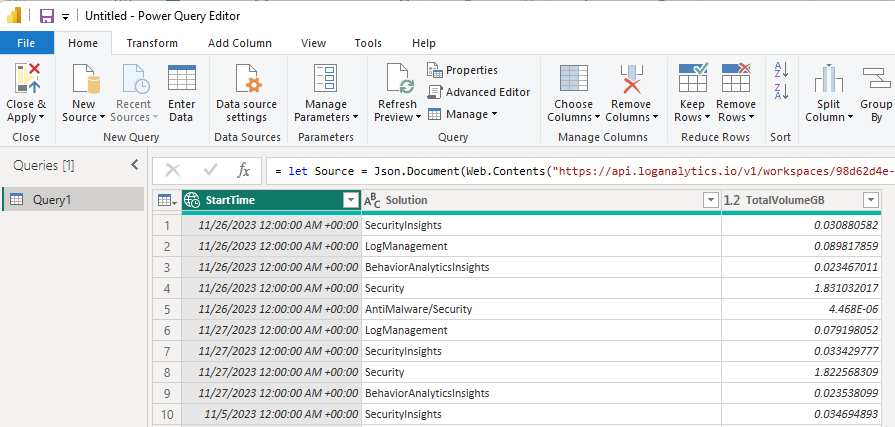
4 - A preview of your data will populate in a table for verification.
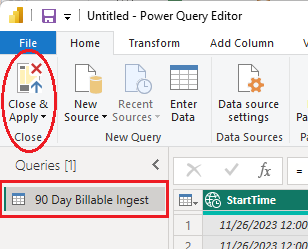
5 - Rename your Query to 90 Day Billable Ingest in the Advanced Editor, then select Close & Apply
Manipulate Data Sets and Render Visuals:
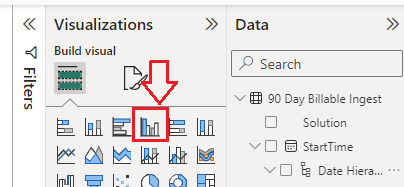
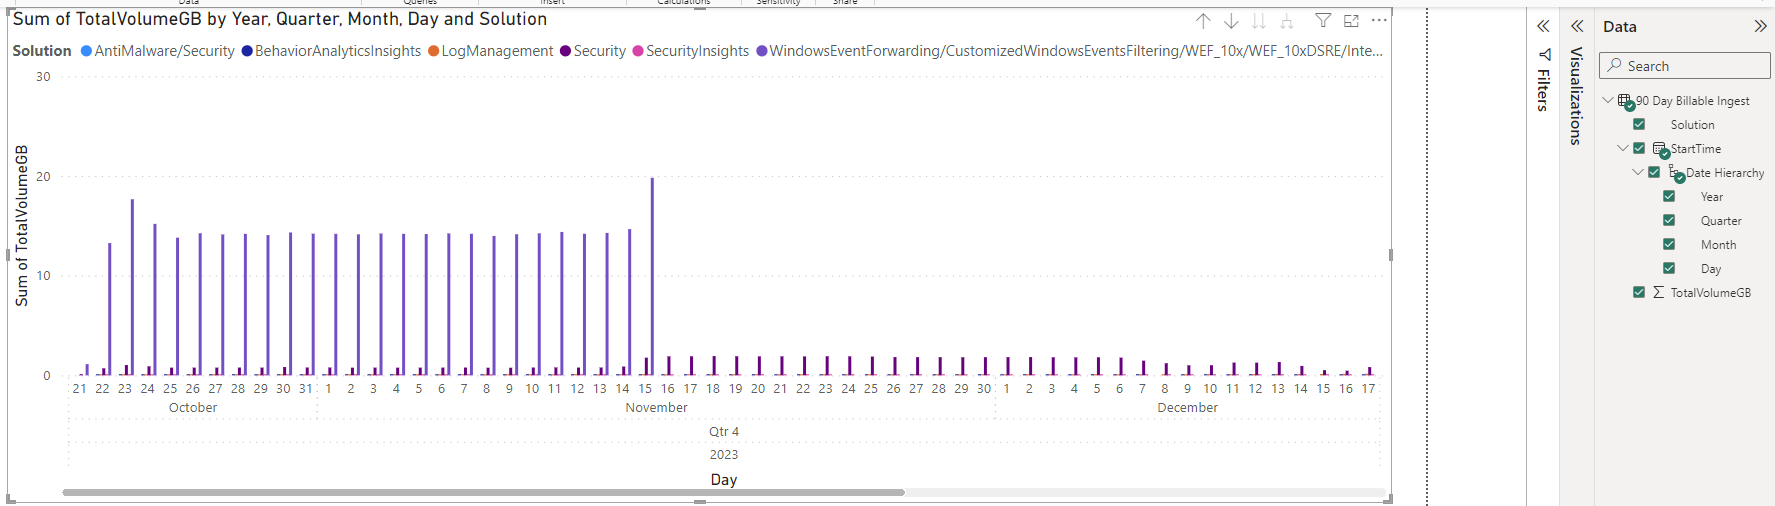
1 - Now that we’ve imported our dataset, lets do something with it! Select the Visuals tab on the right and choose Clustered Column Chart
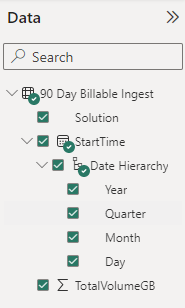
2 - Select All of the data sources from the Data tab on the right under our 90 Day billable Ingest Trend dataset.
3 - The bar chart renders with data from the selected dataset.
4 - Rename the page and create additional pages as illustrated below:
💡 Real Talk: Right about now you’re probably asking yourself “So I have to edit line 2 in the original query and re-run it, export the M query, then import each data set into PowerBI every time? … that’s not optimial…” …and you’d be right, so lets streamline this!
⚡ You can re-use the original PowerBIQuery.txt for the rest, here’s how to adjust the time frame on the fly:
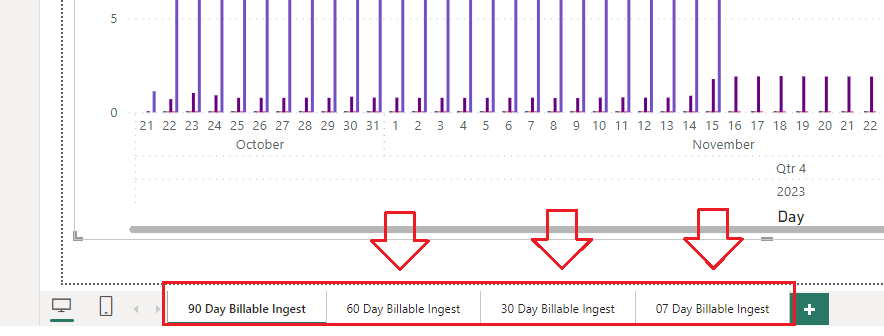
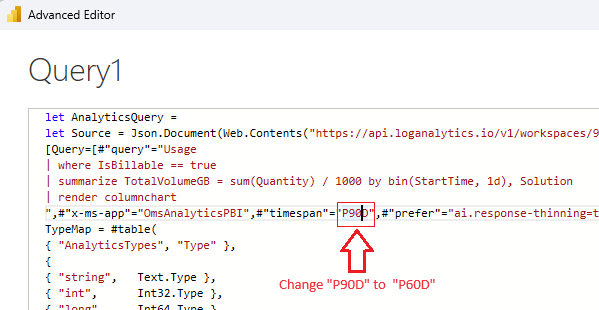
1 - Open a new page, rename it to 60 Day Billable Ingest and select Get Data just like we did earlier and import your original PowerBIQuery.txt file, only this time before clicking on Close & Apply, look in the query window for “P90D” and swap it out for “P60D” to change the timeframe that this M query will apply to without having to regenerate the whole M query, illustrated below:
2 - Select Close & Apply, then create your preferred visual the same way we rendered a bar graph in previous steps.
3 - Create a new page and rename it to 30 Day Billable Ingest, and repeat previous steps for 30 days, then 7, or up to the last 30 minutes, or as far back as your retention allows.
Save and Export our Report to PDF:
- File > Export > Export to PDF
Re-run our report with 1-click!
- Save your PowerBI report to easily generate again next quarter. As long as you’re signed into PowerBI with an account that has sufficient privileges to read from your workspace next quarter, that’s all there is to it!
Achieve Awesome-ness
In my experience, 90, 60, and 30 day trends tend to lend themselves pretty well to Quarterly Business Reviews and deliver added value. What sort of reports will YOU automate?
Thanks for reading! Follow me on LinkedIn or Twitter @IanDHanley for more insights into leveraging the Microsoft Security fabric for favourable security outcomes. Don’t forget to check out my KQL Query library and other projects on my GitHub!
In this Post We:
- 👉Defined our report and the underlying KQL
- 👉Ran and exported our KQL to a PowerBI M Query
- 👉Imported our M Query into PowerBI
- 👉Manipulated Data Sets and Rendered Visuals
- 👉Saved and Exported our Report to PDF
- 👉Re-ran our report with 1-click!
- 👉Achieved a State of Awesome-ness 😎
📚 Want to go deeper?
My Toolbox books turn real Microsoft security telemetry into defensible operations:

🧰 PowerShell Toolbox Hands-On Automation for Auditing and Defense

🛠️ KQL Toolbox: Turning Logs into Decisions in Microsoft Sentinel

📖 Ultimate Microsoft XDR for Full Spectrum Cyber Defense
Real-world detections, Sentinel, Defender XDR, and Entra ID — end to end.
References & Resources:
- Role Based Access Control (RBAC) Roles
- PowerBI Licensing/Pricing
- Create a Log Analytics Workspace
- 90 Day Billable Ingest Volume.kql
- Ian Hanley’s deceptively simple KQL queries
- Azure Portal
