Introduction and Use Case:
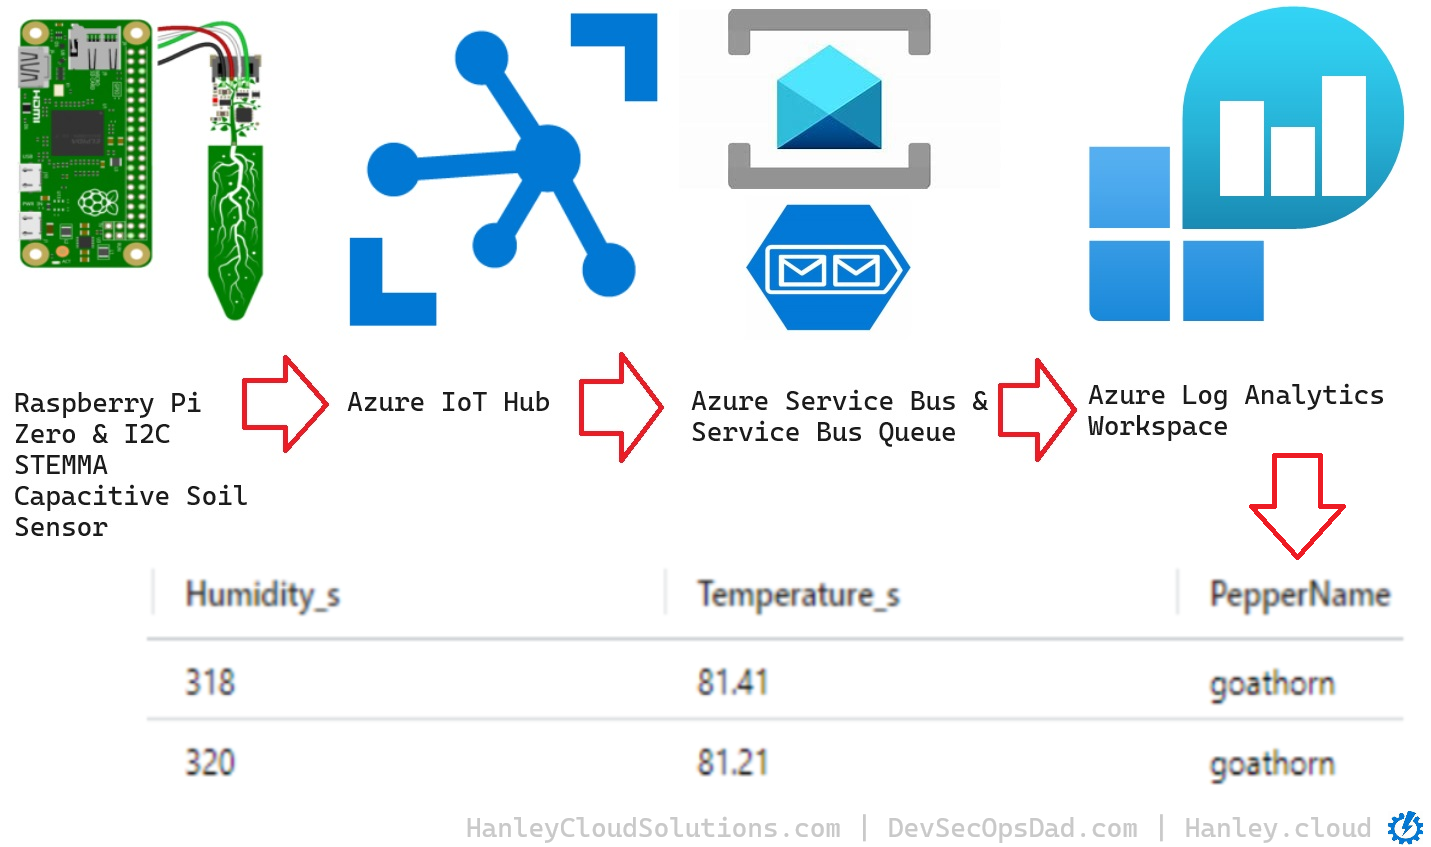
This follows up on a previous post where we built a Raspberry Pi based soil sensor and onboarded it to Azure IoT Hub. What next? How do we read that data and get it into a Log Analytics Workspace? 🤔
Some advanced readers may have thought to make a diagnostics setting in the IoT Hub to forward telemetry data to a workspace, only to find just the ‘telemetry’ data (send success/fail and other telemetry metrics 📈) but not the actual message data make it into the AzureDiagnostics table in a workspace (good guess though, that was my first move too 😏).
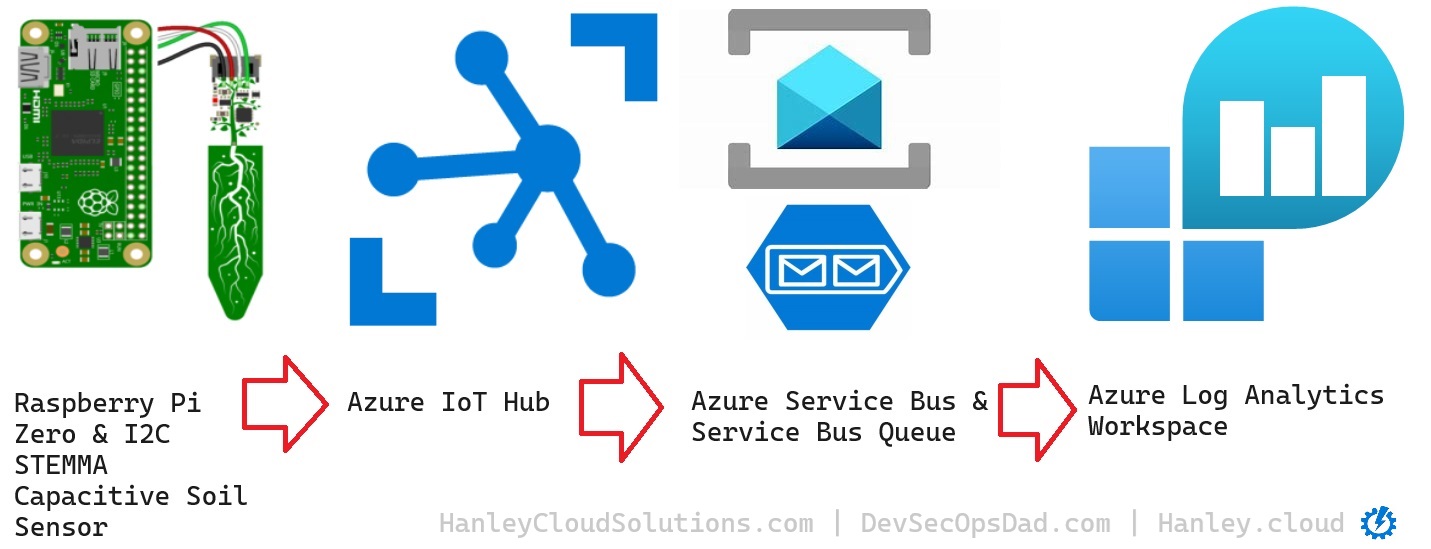
The best way to get our soil Sensor messages from IoT Hub into a Log Analytics workspace is from IoT Hub through a Service Bus via Service Bus Queue, and into a Logic App which can parse the ‘message’ data, then finally send it to a Log Analytics Workspace, like this:
📨 IOT Hub ➡ Service Bus ➡ Logic App ➡ Log Analytics Workspace 📉
In this Post We Will:
- 👉 Create an Azure Service Bus & Service Bus Queue 📩
- 👉 Setup an Azure Log Analytics Workspace 📊
- 👉 Build a Logic App to Parse and send the Message Data 📨
- 👉 Accomplish something AWESOME today! 😎
Create Azure Service Bus & Service Bus Queue
-
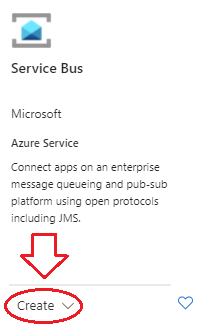
Login to the Azure portal and click +Create a Resource button, then search for Service Bus in the Marketplace.
-
Select Service Bus then Create.
- Select the Subscription, Resource Group, Logic App Name, Region, Enable Log Analytics, Plan, and Zone Redundancy for our Logic App.
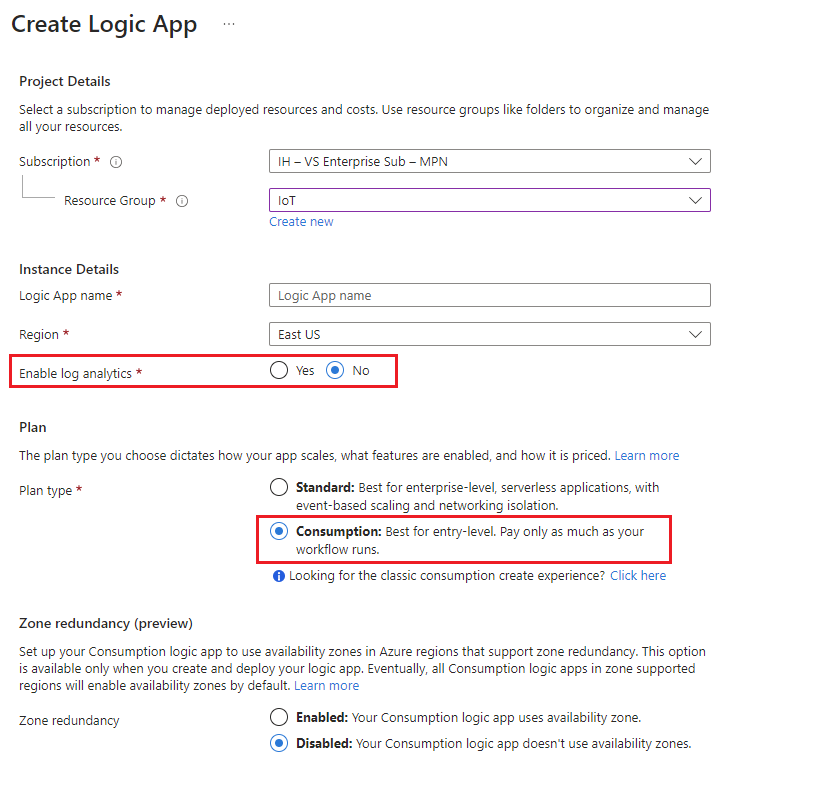
- For Enable Log Analytics section, select No because this doesn’t pass on the message date; only the diagnostic data and other metrics.
- For Pricing Tier choose the Consumption plan.
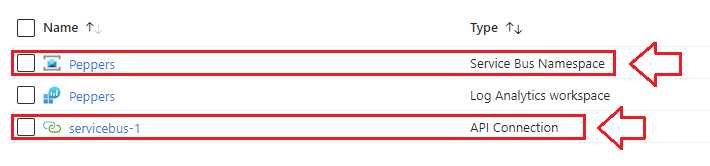
👉 A servicebus-1 API Connection will be auto-generated when you succesfully create your service bus.
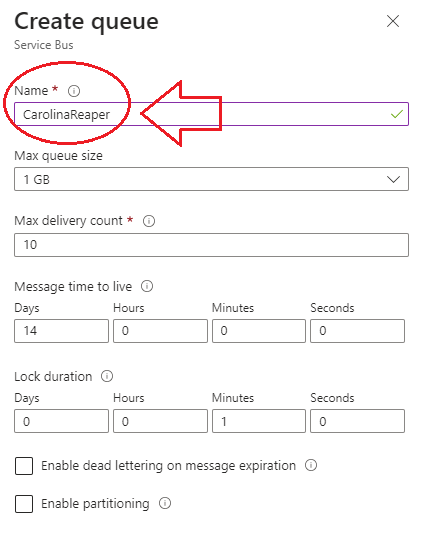
- Navigate to the Queues blade under Entities and select + Queue
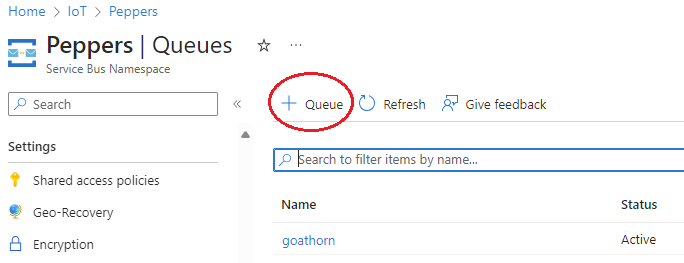
- Name your queue after the pepper or plant you’re monitoring. You can leave the other settings alone.
Create a Log Analytics Workspace
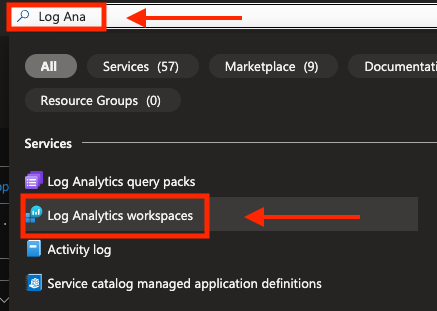
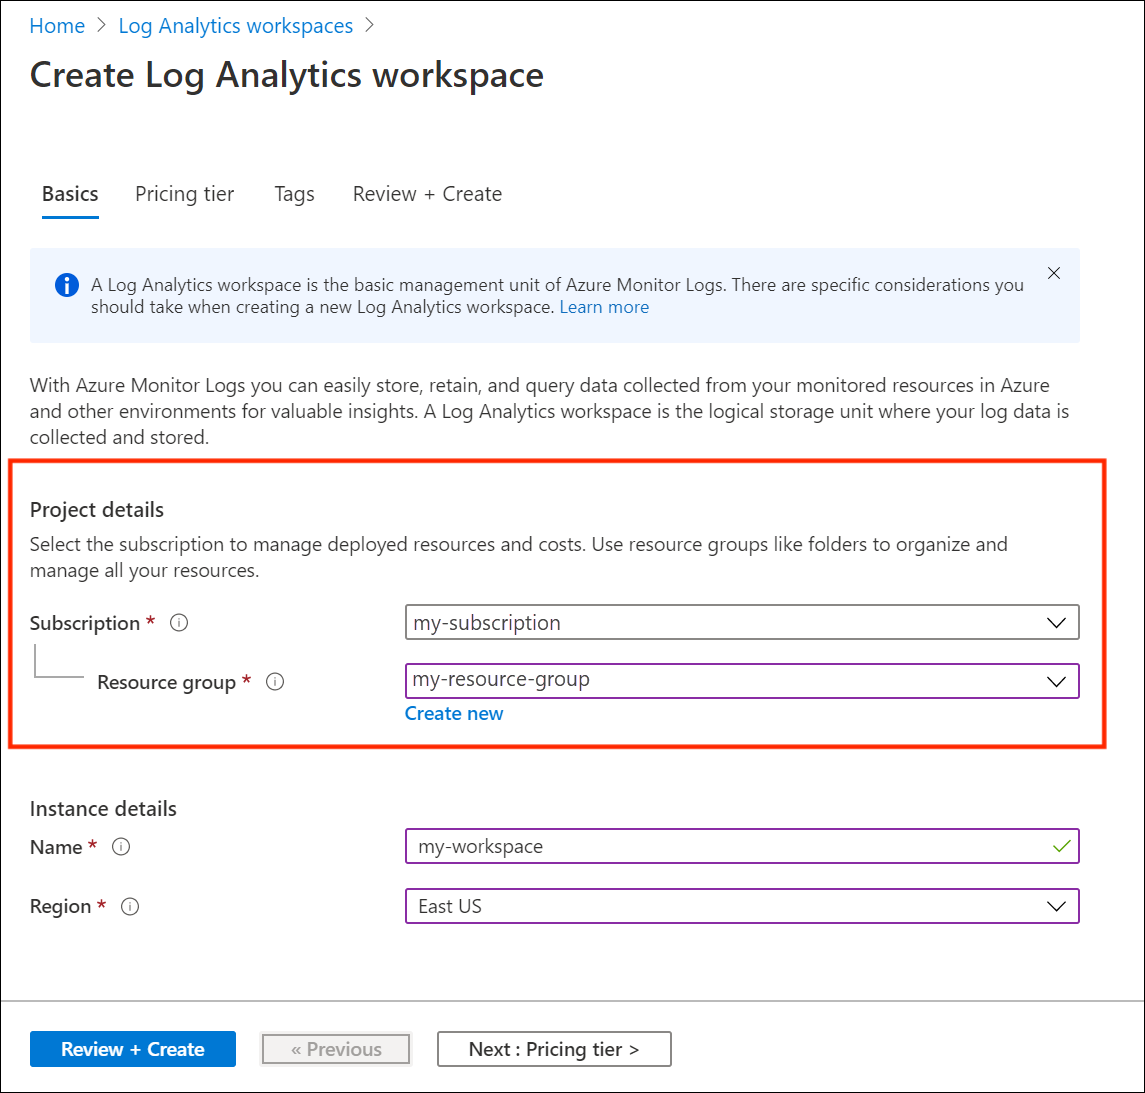
- If you don’t already have one ready, navigate to Log Analytics Workspace in Azure Portal and follow the below steps to get one going (these steps are taken from a previous post so you might notice different resource groups etc. in the following screenshots. For this exercise I kept everything in a resource group called “IoT” and called my workspace “Peppers”):
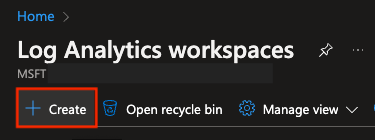
- Select +Create
- Select Subscription and Resource Group:
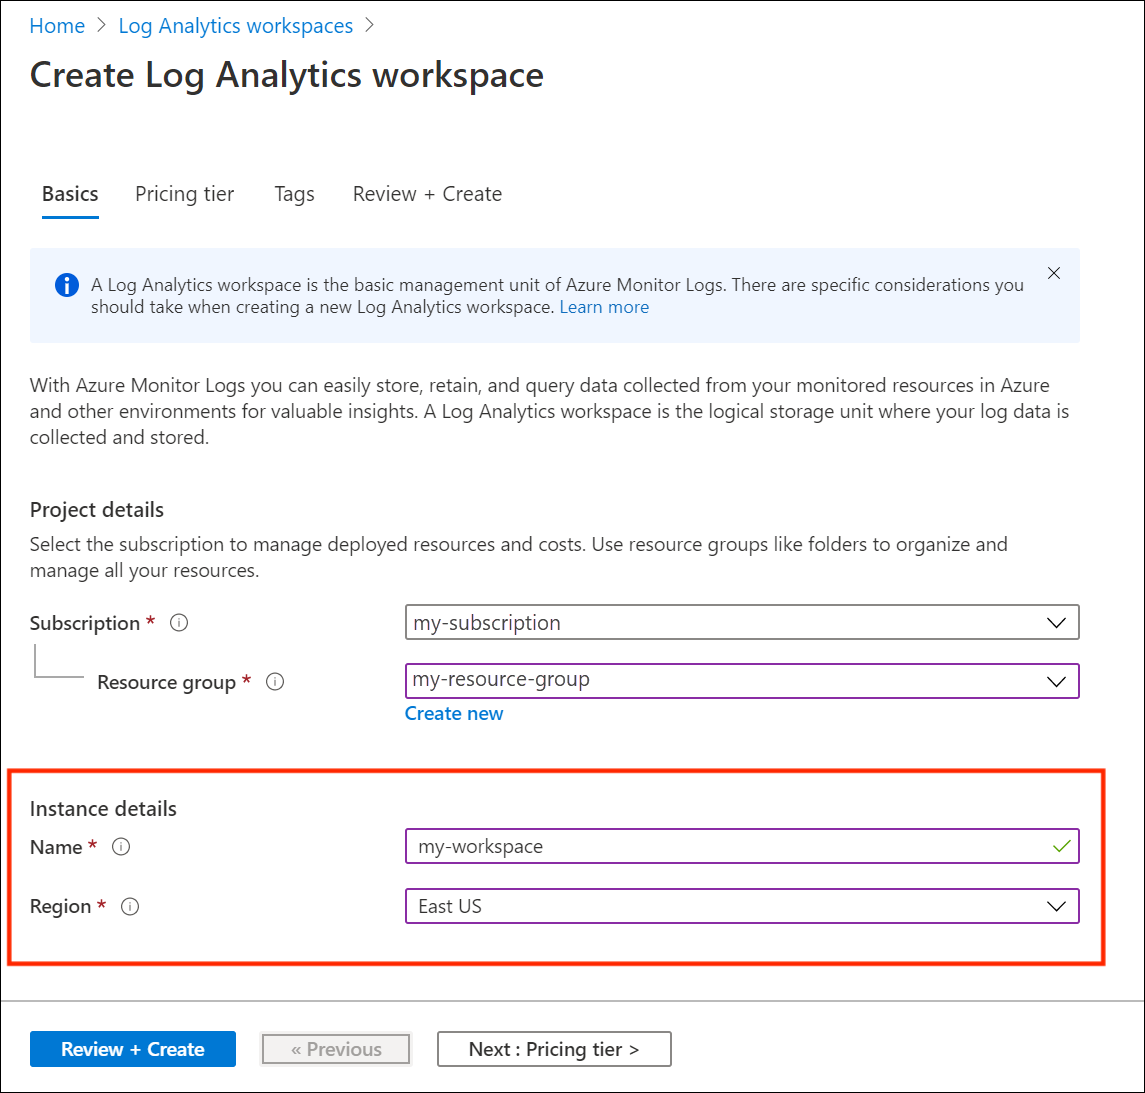
- Select Instance Name and Region:
Commitment / Pricing Tiers
Choose the appropriate commitment tier given your expected daily ingest volume.
It makes sense to bump up to the 100GB/day commitment tier even when you hit as little as 50GB/day because of the 50% discount afforded at 100GB/day, for example.
💡 Check out my prior Sentinel Cost Optimization articles and exercises Parts 1 and 2 at hanley.cloud. While you’re at it, don’t forget to peruse my GitHub repository for KQL breakdowns and ready-made queries for all kinds of complicated situations that you can simply copy and paste.
- Click Review & Create …to Finish Setting up a New Log Analytics Workspace
Build Logic App
-
Search for Logic Apps in the top search bar and click on the icon, then + Add
-
On the next page, fill out the required details as shown below. Make sure to select No for Enable log analytics unless you want Diagnostics for the Logic App forwarded as well.
-
Open the new app in Logic App Designer and let’s build this out in 4 steps!
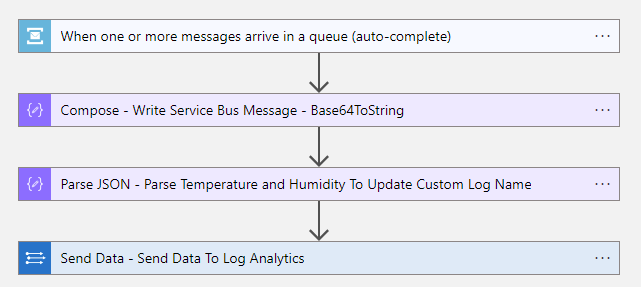
Step 1: Trigger - When one or more messages arrive in a queue (auto-complete)
- Name your queue after the sensor sending the data.
👉 You can send multiple sensors across multiple queues on a single service bus to a log analytics workspace. I named my Service Bus Peppers and have 2 queues at the time of writing this article: Goat Horn and Szechuan 🌶🌶🌶
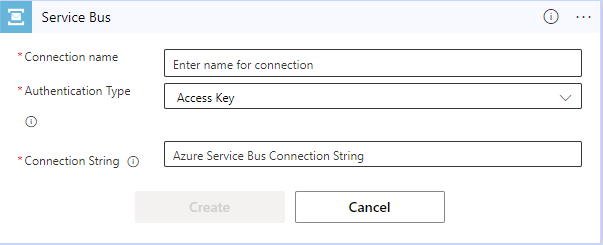
- Setup your connection:
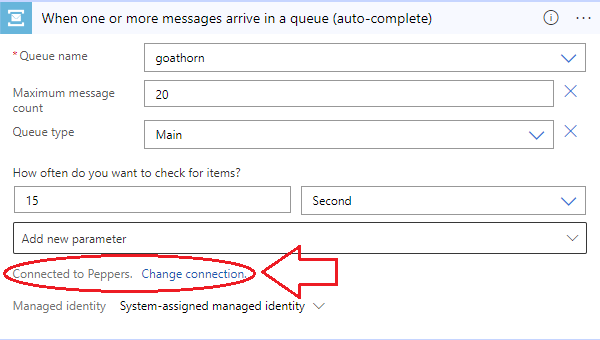
- Set your connection to the Service Bus
Step 2: Compose - Write Service Bus Message - Base64ToString
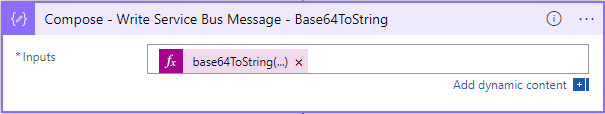
- Use the following expression to convert the message to string:
base64ToString(triggerBody()?['ContentData'])
Step 3: Parse JSON - Parse Temperature and Humidity to Update Custom Log
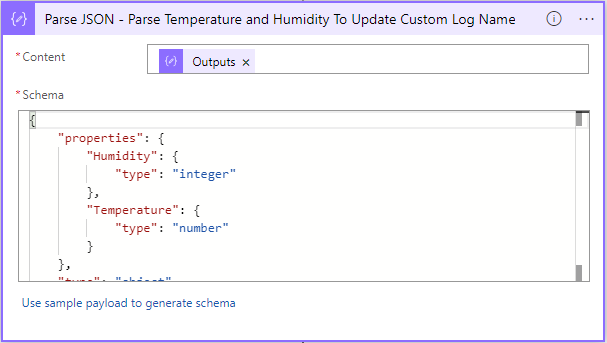
- Use the following schema to tell the parser how to read the message data:
{
    "properties": {
        "Humidity": {
            "type": "integer"
        },
        "Temperature": {
            "type": "number"
        }
    },
    "type": "object"
}
Step 4: Send Data - Send Data to Log Analytics
- Fill out the request body as illustrated:
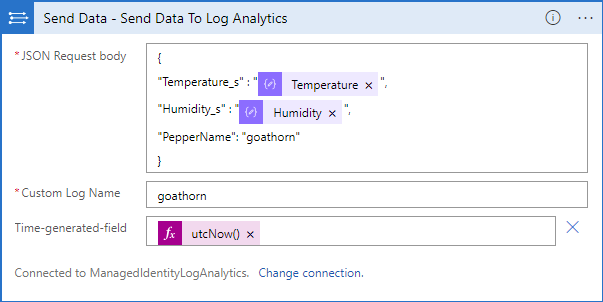
👉 An azureloganalyticsdatacollector-1 API Connection will show up auto-magically when you succesfully create your Logic App (just like the servicebus-1 API connection earlier).
Confirm Results in Log Analytics Workspace:
Navigate to your Log Analytics Workspace and query your new custom list:
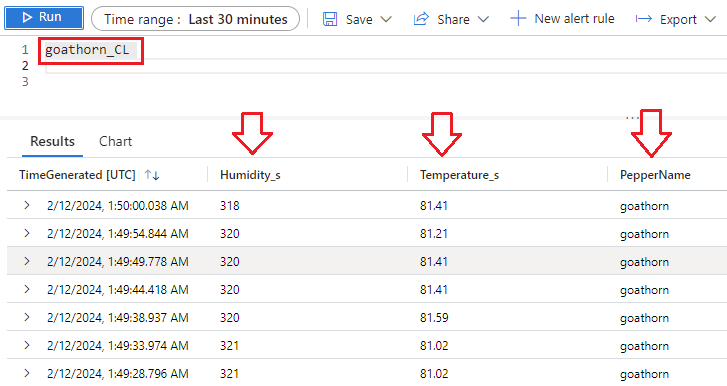
Here we can see the Temperate and Humidity by Pepper❗
🌱 🌿 What will you grow? 🌼🌻
In this Post We:
- 👉 Created an Azure Service Bus & Service Bus Queue 📩
- 👉 Setup an Azure Log Analytics Workspace 📊
- 👉 Built a Logic App to Parse and send the Message Data 📨
- 👉 Accomplished something AWESOME today! 😎
Next Time:
TODAY we’ve managed to get just one IoT device registered and transmitting it’s sensor data across a service bus and custom endpoint to a Log Analytics Workspace.
NEXT TIME we’ll look at the free tiered Azure IoT Hub’s most significant limitation - the custom endpoint bottleneck - and how to solve it with a well constructed logic app so that we can scale this up and get readings for more peppers.
👉 This circumvents the restrictions on the free tiered Azure IoTHub, allowing you to transmitt data from multiple IoT devices simultaneously without upgrading your subscription 😎
📚 Want to go deeper?
My Toolbox books turn real Microsoft security telemetry into defensible operations:
🧰 PowerShell Toolbox Hands-On Automation for Auditing and Defense
🛠️ KQL Toolbox: Turning Logs into Decisions in Microsoft Sentinel

📖 Ultimate Microsoft XDR for Full Spectrum Cyber Defense
Real-world detections, Sentinel, Defender XDR, and Entra ID — end to end.