🌿 Introduction & Use Case:
If you’ve been following the evolution of the Raspberry Pi Soil Sensor project here on DevSecOpsDad.com, you know it began as a fun side experiment. From the original build leveraging 3rd party tools like FluentD, to the more robust Sensor 2.0 upgrade and its multi-part series which includes to use of logic apps for automation and to overcome the bottleneck in Azure IoT Hub; we’ve integrated soil moisture and temperature readings into Azure Sentinel, Microsoft’s cloud-native SIEM.
But what if you want all the plant-monitoring goodness without the complexity of Sentinel, Log Analytics, or any cloud integration?
This guide shows you how to deploy a completely self-contained Raspberry Pi Zero W soil sensor that logs data locally and hosts a mobile-friendly web dashboard over your Wi-Fi network. No Azure subscription, no SIEM plumbing, no problem—just real-time environmental telemetry accessible from your phone or browser.
Whether you’re a home lab enthusiast, gardener, or someone just looking to build a clean local IoT project, this stripped-down deployment keeps all the insights and skips the cloud complexity, taking you from a blank SD card to a fully functional soil sensor web dashboard.
📋 Hardware Requirements
- Raspberry Pi Zero W (but any Pi should work)
- MicroSD card (16GB+ recommended)
- I2C Soil Moisture & Temperature Sensor
- JST PH 2mm 4-Pin to Female Socket I2C STEMMA jumper cable
- MicroUSB power supply
🔧 Part 1: Initial Pi Setup (Headless)
Step 1: Flash Raspberry Pi OS
- Download Raspberry Pi Imager
- Flash Raspberry Pi OS Lite (Bullseye) to your SD card
- Important: Don’t eject the SD card yet!
Step 2: Enable SSH and WiFi (Headless Setup)
After flashing, the SD card will remount. Navigate to the boot partition and:
- Enable SSH: Create an empty file named
ssh(no extension)# On Windows: Create empty file called "ssh" in boot drive # On Mac/Linux: touch /Volumes/boot/ssh - Configure WiFi: Create
wpa_supplicant.confin the boot partition:# Create file: wpa_supplicant.conf country=US ctrl_interface=DIR=/var/run/wpa_supplicant GROUP=netdev update_config=1 network={ ssid="YOUR_WIFI_NAME" psk="YOUR_WIFI_PASSWORD" }⚠️ Replace
YOUR_WIFI_NAMEandYOUR_WIFI_PASSWORDwith your actual WiFi credentials ⚠️
Step 3: Boot and Connect
- Insert SD card into Pi Zero W
- Power on the Pi
- Wait 2-3 minutes for boot
- Find Pi’s IP address:
- Check your router’s admin panel
- Use network scanner app
- Try:
ping raspberrypi.local
Step 4: SSH Into Your Pi
ssh pi@[PI_IP_ADDRESS]
# or
ssh pi@raspberrypi.local

# Default password: raspberry
🔄 Part 2: System Configuration
Step 5: Basic System Setup
# Update system
sudo apt update && sudo apt upgrade -y

# Change default password (IMPORTANT!)
passwd

# Set timezone
sudo raspi-config
# Navigate: Localisation Options > Timezone > [Your Region] > [Your City]

# Expand filesystem
sudo raspi-config
# Navigate: Advanced Options > Expand Filesystem

# Enable I2C
sudo raspi-config
# Navigate: Interfacing Options > I2C > Enable

# Reboot to apply changes
sudo reboot
Wait for reboot, then reconnect via SSH
Step 6: Install Required System Packages
# Install core packages
sudo apt install -y python3 python3-pip apache2 sqlite3 git i2c-tools

# Install Python I2C libraries
sudo apt install -y python3-smbus python3-dev

# Enable Apache CGI module
sudo a2enmod cgi

# Start and enable Apache
sudo systemctl enable apache2
sudo systemctl start apache2
🔌 Part 3: Hardware Connection
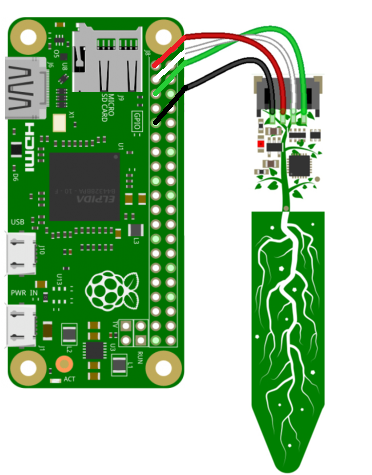
Step 7: Connect Your Sensor
Connect the I2C soil sensor to your Pi Zero W:
Sensor Pin    →    Pi Zero W Pin
VCC (Red)     →    3.3V (Pin 1)
GND (Black)   →    Ground (Pin 6)
SDA (White)    →    GPIO 2/SDA (Pin 3)
SCL (Green)  →    GPIO 3/SCL (Pin 5)
Step 8: Test Hardware Connection
# Test I2C connection
sudo i2cdetect -y 1

# You should see address 36 populated:
#      0  1  2  3  4  5  6  7  8  9  a  b  c  d  e  f
# 00: -- -- -- -- -- -- -- -- -- -- -- -- -- -- -- --
# 10: -- -- -- -- -- -- -- -- -- -- -- -- -- -- -- --
# 20: -- -- -- -- -- -- -- -- -- -- -- -- -- -- -- --
# 30: -- -- -- -- -- -- 36 -- -- -- -- -- -- -- -- --
👉 If you don’t see address 36, check your wiring!
🐍 Part 4: Install Python Dependencies
Step 9: Install Sensor Libraries
# Install Adafruit libraries
sudo pip3 install adafruit-blinka
sudo pip3 install adafruit-circuitpython-busdevice
sudo pip3 install adafruit-circuitpython-seesaw
📁 Part 5: Deploy the Soil Sensor Application
Step 10: Create Application Structure
# Create directories
sudo mkdir -p /opt/soil_sensor
sudo mkdir -p /var/log

# Make sure Apache CGI directory is ready
sudo chmod 755 /usr/lib/cgi-bin
Step 11: Install Main Sensor Script
# Create the sensor reader script
sudo nano /opt/soil_sensor/sensor_reader.py
#!/usr/bin/env python3
"""
Raspberry Pi Zero W Soil Sensor Data Logger
Reads I2C soil moisture and temperature sensor data and stores in SQLite database
"""

import time
import sqlite3
import json
from datetime import datetime, timedelta
import board
import busio
from adafruit_seesaw.seesaw import Seesaw
from adafruit_seesaw.seesaw import Seesaw  # Redundant import, but harmless
import logging

# Configure logging to file and stdout for troubleshooting and monitoring
logging.basicConfig(
    level=logging.INFO,
    format='%(asctime)s - %(levelname)s - %(message)s',
    handlers=[
        logging.FileHandler('/var/log/soil_sensor.log'),  # Log file path
        logging.StreamHandler()  # Also log to console
    ]
)

class SoilSensorLogger:
    def __init__(self, db_path='/var/www/html/sensor_data.db'):
        # Path to the SQLite database (served from the web directory)
        self.db_path = db_path
        self.setup_database()  # Create DB schema if needed
        self.setup_sensor()    # Initialize I2C sensor

    def setup_database(self):
        """Initialize SQLite database with sensor data table"""
        try:
            conn = sqlite3.connect(self.db_path)
            cursor = conn.cursor()

            # Create the main table to store sensor readings
            cursor.execute('''
                CREATE TABLE IF NOT EXISTS sensor_readings (
                    id INTEGER PRIMARY KEY AUTOINCREMENT,
                    timestamp DATETIME DEFAULT CURRENT_TIMESTAMP,
                    temperature REAL,
                    moisture INTEGER
                )
            ''')

            # Index for faster queries by timestamp
            cursor.execute('''
                CREATE INDEX IF NOT EXISTS idx_timestamp ON sensor_readings(timestamp)
            ''')

            conn.commit()
            conn.close()
            logging.info("Database initialized successfully")

        except Exception as e:
            logging.error(f"Database setup error: {e}")
            raise

    def setup_sensor(self):
        """Initialize I2C connection to soil sensor"""
        try:
            # Create I2C bus on default SCL/SDA pins
            i2c_bus = busio.I2C(board.SCL, board.SDA)

            # Initialize the Seesaw sensor at address 0x36
            self.ss = Seesaw(i2c_bus, addr=0x36)

            logging.info("Sensor initialized successfully")

        except Exception as e:
            logging.error(f"Sensor setup error: {e}")
            raise

    def read_sensor_data(self):
        """Read temperature and moisture from sensor"""
        try:
            # Get temperature in Celsius
            temp = self.ss.get_temp()

            # Get moisture reading (range: 0-1023)
            moisture = self.ss.moisture_read()

            logging.info(f"Sensor reading - Temperature: {temp:.1f}°C, Moisture: {moisture}")

            return temp, moisture

        except Exception as e:
            logging.error(f"Sensor reading error: {e}")
            return None, None

    def store_reading(self, temperature, moisture):
        """Store sensor reading in database"""
        try:
            conn = sqlite3.connect(self.db_path)
            cursor = conn.cursor()

            # Insert a new row of data into the table
            cursor.execute('''
                INSERT INTO sensor_readings (temperature, moisture)
                VALUES (?, ?)
            ''', (temperature, moisture))

            conn.commit()
            conn.close()

            logging.info(f"Data stored successfully - Temp: {temperature:.1f}°C, Moisture: {moisture}")

        except Exception as e:
            logging.error(f"Database storage error: {e}")

    def cleanup_old_data(self, days=30):
        """Remove data older than specified days"""
        try:
            conn = sqlite3.connect(self.db_path)
            cursor = conn.cursor()

            # Calculate timestamp cutoff for deletion
            cutoff_date = datetime.now() - timedelta(days=days)

            # Delete records older than cutoff
            cursor.execute('''
                DELETE FROM sensor_readings
                WHERE timestamp < ?
            ''', (cutoff_date,))

            deleted_rows = cursor.rowcount
            conn.commit()
            conn.close()

            if deleted_rows > 0:
                logging.info(f"Cleaned up {deleted_rows} old records")

        except Exception as e:
            logging.error(f"Database cleanup error: {e}")

    def get_latest_reading(self):
        """Get the most recent sensor reading"""
        try:
            conn = sqlite3.connect(self.db_path)
            cursor = conn.cursor()

            # Select the most recent row from the table
            cursor.execute('''
                SELECT timestamp, temperature, moisture
                FROM sensor_readings
                ORDER BY timestamp DESC
                LIMIT 1
            ''')

            result = cursor.fetchone()
            conn.close()

            if result:
                return {
                    'timestamp': result[0],
                    'temperature': result[1],
                    'moisture': result[2]
                }
            return None

        except Exception as e:
            logging.error(f"Database query error: {e}")
            return None

    def run_single_reading(self):
        """Take a single sensor reading and store it"""
        logging.info("Starting sensor reading...")

        # Read temperature and moisture
        temperature, moisture = self.read_sensor_data()

        if temperature is not None and moisture is not None:
            # Store the data
            self.store_reading(temperature, moisture)

            # Clean up older entries
            self.cleanup_old_data()

            # Update the JSON file for web access
            self.update_latest_json(temperature, moisture)

            logging.info("Sensor reading cycle completed successfully")
            return True
        else:
            logging.error("Failed to read sensor data")
            return False

    def update_latest_json(self, temperature, moisture):
        """Update JSON file with latest reading for web interface"""
        try:
            latest_data = {
                'timestamp': datetime.now().isoformat(),  # ISO format for compatibility
                'temperature': round(temperature, 1),
                'moisture': moisture,
                'temperature_f': round((temperature * 9/5) + 32, 1)  # Convert to Fahrenheit
            }

            # Save latest reading as JSON to be used by web dashboard
            with open('/var/www/html/latest_reading.json', 'w') as f:
                json.dump(latest_data, f, indent=2)

        except Exception as e:
            logging.error(f"JSON update error: {e}")

def main():
    """Main function to run sensor logger"""
    try:
        logger = SoilSensorLogger()  # Initialize logger
        success = logger.run_single_reading()  # Run full sensor + store cycle

        if success:
            print("Sensor reading completed successfully")
        else:
            print("Sensor reading failed")
            exit(1)

    except Exception as e:
        logging.error(f"Main execution error: {e}")
        print(f"Error: {e}")
        exit(1)

# Ensure script runs only when executed directly, not when imported
if __name__ == "__main__":
    main()
☝ This Python script is a soil sensor data logger designed for the Raspberry Pi Zero W. It interfaces with an Adafruit STEMMA I²C soil sensor to collect temperature and moisture data, storing each reading in a local SQLite database. The script also writes the latest reading to a JSON file, enabling easy integration with a self-hosted web interface for real-time monitoring. Key features include automatic database initialization, I²C sensor setup, data cleanup routines for managing storage, and a built-in logging mechanism for diagnostics. The program is structured as a class (SoilSensorLogger) with modular methods that handle sensor interaction, database management, and web data export. It’s optimized for periodic execution—ideal for use with cron or a systemd timer—making it a robust foundation for environmental monitoring projects in gardens, greenhouses, or smart home setups.
Copy and paste the sensor_reader.py file described above, then:
# Make executable
sudo chmod +x /opt/soil_sensor/sensor_reader.py
Step 12: Install Web API Script
# Create the API script
sudo nano /usr/lib/cgi-bin/api.py
#!/usr/bin/env python3
"""
CGI API script to serve sensor data to web interface
Place in /usr/lib/cgi-bin/ directory
"""

import cgi                      # For parsing query parameters in CGI requests
import cgitb                    # For detailed error tracebacks in browser
import json                     # For encoding Python objects to JSON
import sqlite3                  # SQLite database access
from datetime import datetime, timedelta  # For time manipulation
import sys                      # Provides access to system-specific parameters
import os                       # Operating system interface (not used in code but imported)

# Enable detailed error reporting in browser for debugging CGI scripts
cgitb.enable()

# CGI scripts must start with content-type headers before output
print("Content-Type: application/json")
print()  # Blank line separates headers from response body

def get_db_connection():
    """Establish and return connection to SQLite database"""
    db_path = '/var/www/html/sensor_data.db'  # Path to SQLite database file
    return sqlite3.connect(db_path)

def get_latest_reading():
    """Fetch the most recent sensor reading from the database"""
    try:
        conn = get_db_connection()
        cursor = conn.cursor()

        # Query to get the most recent row by timestamp
        cursor.execute('''
            SELECT timestamp, temperature, moisture
            FROM sensor_readings
            ORDER BY timestamp DESC
            LIMIT 1
        ''')

        result = cursor.fetchone()
        conn.close()

        # If a result is found, format and return it
        if result:
            return {
                'timestamp': result[0],
                'temperature': round(result[1], 1),
                'moisture': result[2],
                'temperature_f': round((result[1] * 9/5) + 32, 1)  # Convert °C to °F
            }
        return None  # No data in table

    except Exception as e:
        # Return any error message as part of the JSON response
        return {'error': str(e)}

def get_historical_data(hours=24):
    """Retrieve sensor readings from the past 'hours' period"""
    try:
        conn = get_db_connection()
        cursor = conn.cursor()

        # Calculate cutoff time (now - specified hours)
        cutoff_time = datetime.now() - timedelta(hours=hours)

        # Fetch rows where the timestamp is within the period
        cursor.execute('''
            SELECT timestamp, temperature, moisture
            FROM sensor_readings
            WHERE timestamp >= ?
            ORDER BY timestamp ASC
        ''', (cutoff_time,))

        results = cursor.fetchall()
        conn.close()

        # Format each row into a dictionary for JSON output
        data = []
        for row in results:
            data.append({
                'timestamp': row[0],
                'temperature': round(row[1], 1),
                'moisture': row[2],
                'temperature_f': round((row[1] * 9/5) + 32, 1)
            })

        return data

    except Exception as e:
        # Return any error that occurred
        return {'error': str(e)}

def get_statistics(hours=24):
    """Compute basic statistics on temperature and moisture over past 'hours'"""
    try:
        conn = get_db_connection()
        cursor = conn.cursor()

        # Calculate the cutoff time for the statistics window
        cutoff_time = datetime.now() - timedelta(hours=hours)

        # SQL aggregates to compute count, average, min, and max values
        cursor.execute('''
            SELECT
                COUNT(*) as count,
                AVG(temperature) as avg_temp,
                MIN(temperature) as min_temp,
                MAX(temperature) as max_temp,
                AVG(moisture) as avg_moisture,
                MIN(moisture) as min_moisture,
                MAX(moisture) as max_moisture
            FROM sensor_readings
            WHERE timestamp >= ?
        ''', (cutoff_time,))

        result = cursor.fetchone()
        conn.close()

        # Only return statistics if at least one row is found
        if result and result[0] > 0:
            return {
                'count': result[0],
                'temperature': {
                    'average': round(result[1], 1),
                    'minimum': round(result[2], 1),
                    'maximum': round(result[3], 1)
                },
                'moisture': {
                    'average': round(result[4], 0),
                    'minimum': result[5],
                    'maximum': result[6]
                }
            }
        return {'count': 0}  # No rows matched

    except Exception as e:
        return {'error': str(e)}

def main():
    """Main handler for CGI requests"""
    try:
        # Parse query string parameters (e.g., ?action=latest)
        form = cgi.FieldStorage()
        action = form.getvalue('action', 'latest')  # Default to 'latest'
        period = form.getvalue('period', '24')      # Default to 24 hours

        # Convert 'period' to integer, default to 24 on failure
        try:
            period_hours = int(period)
        except (ValueError, TypeError):
            period_hours = 24

        # Route to appropriate data handler based on 'action' parameter
        if action == 'latest':
            data = get_latest_reading()
        elif action == 'history':
            data = get_historical_data(period_hours)
        elif action == 'stats':
            data = get_statistics(period_hours)
        else:
            data = {'error': 'Invalid action parameter'}

        # Output data as formatted JSON
        print(json.dumps(data, indent=2))

    except Exception as e:
        # Handle any unexpected server-side exceptions
        error_response = {'error': f'Server error: {str(e)}'}
        print(json.dumps(error_response, indent=2))

# Entry point for CGI execution
if __name__ == '__main__':
    main()
☝ This api.py script is a CGI-based Python API designed to serve sensor data from a Raspberry Pi Zero W soil sensor to a web interface. It retrieves real-time and historical sensor readings—such as temperature and soil moisture—from a local SQLite database and returns the results as JSON-formatted output. Users can interact with the API by specifying query parameters (action=latest, history, or stats), allowing the web frontend to fetch the latest reading, historical data for a given period, or a statistical summary (including averages and min/max values).
⚡ The script follows good practices like structured exception handling, input validation, and modular design with reusable functions. It includes logic to convert temperature from Celsius to Fahrenheit, making the output more accessible. Designed to be placed in the /usr/lib/cgi-bin/ directory, the script prints proper HTTP headers for JSON content and uses Python’s built-in cgi and sqlite3 modules, making it lightweight and easy to deploy on embedded devices like the Raspberry Pi.
Copy and paste the api.py described above, then:
# Make executable
sudo chmod +x /usr/lib/cgi-bin/api.py
Step 13: Install Web Interface
# Remove default Apache page
sudo rm /var/www/html/index.html

# Create new dashboard
sudo nano /var/www/html/index.html
<!DOCTYPE html>
<html lang="en">
<head>
<!-- Define the character encoding and responsive behavior -->
<meta charset="UTF-8">
<meta name="viewport" content="width=device-width, initial-scale=1.0">
<title>Soil Sensor Dashboard</title>
<!-- Include Chart.js library for rendering the graphs -->
<script src="https://cdnjs.cloudflare.com/ajax/libs/Chart.js/3.9.1/chart.min.js"></script>
<style>
/* General body styling for layout and background */
body {
font-family: Arial, sans-serif;
margin: 0;
padding: 20px;
background-color: #f5f5f5;
}
/* Container to center and cap the dashboard width */
.container {
max-width: 1200px;
margin: 0 auto;
}
/* Styling for the header/banner at the top */
.header {
background: linear-gradient(135deg, #4CAF50, #45a049);
color: white;
padding: 20px;
border-radius: 10px;
margin-bottom: 20px;
text-align: center;
}
.header h1 {
margin: 0;
font-size: 2.5em;
}
.header p {
margin: 10px 0 0 0;
opacity: 0.9;
}
/* Grid layout for the live sensor readings */
.current-readings {
display: grid;
grid-template-columns: repeat(auto-fit, minmax(250px, 1fr));
gap: 20px;
margin-bottom: 30px;
}
/* Individual sensor reading card styling */
.reading-card {
background: white;
padding: 25px;
border-radius: 10px;
box-shadow: 0 2px 10px rgba(0,0,0,0.1);
text-align: center;
}
.reading-value {
font-size: 3em;
font-weight: bold;
margin: 10px 0;
}
/* Specific color for temperature value */
.temperature {
color: #ff6b6b;
}
/* Specific color for moisture value */
.moisture {
color: #4ecdc4;
}
.reading-label {
font-size: 1.2em;
color: #666;
margin-bottom: 5px;
}
.reading-unit {
font-size: 1.5em;
color: #999;
}
.last-updated {
font-size: 0.9em;
color: #888;
margin-top: 10px;
}
/* Container for chart section with visual enhancements */
.charts-section {
background: white;
padding: 25px;
border-radius: 10px;
box-shadow: 0 2px 10px rgba(0,0,0,0.1);
margin-bottom: 20px;
}
/* Controls for switching time periods of the graph */
.chart-controls {
display: flex;
justify-content: center;
gap: 10px;
margin-bottom: 20px;
flex-wrap: wrap;
}
.chart-button {
padding: 10px 20px;
border: none;
border-radius: 5px;
background-color: #4CAF50;
color: white;
cursor: pointer;
font-size: 1em;
}
.chart-button:hover {
background-color: #45a049;
}
.chart-button.active {
background-color: #2e7d32;
}
/* Responsive container for the chart canvas */
.chart-container {
position: relative;
height: 400px;
margin-top: 20px;
}
/* Styling for loading text and error boxes */
.loading {
text-align: center;
padding: 20px;
color: #666;
}
.error {
background-color: #ffebee;
color: #c62828;
padding: 15px;
border-radius: 5px;
margin: 10px 0;
}
/* Status bar displaying connection and update info */
.status-bar {
background: white;
padding: 15px;
border-radius: 10px;
box-shadow: 0 2px 10px rgba(0,0,0,0.1);
display: flex;
justify-content: space-between;
align-items: center;
flex-wrap: wrap;
gap: 10px;
}
.status-indicator {
display: flex;
align-items: center;
gap: 8px;
}
/* Circle indicator for online/offline status */
.status-dot {
width: 12px;
height: 12px;
border-radius: 50%;
background-color: #4CAF50;
}
.status-dot.offline {
background-color: #f44336;
}
/* Responsive adjustments for smaller screens */
@media (max-width: 768px) {
.header h1 {
font-size: 2em;
}
.reading-value {
font-size: 2.5em;
}
.chart-controls {
flex-direction: column;
align-items: center;
}
.status-bar {
flex-direction: column;
text-align: center;
}
}
</style>
</head>
<body>
<!-- Main container holding the entire dashboard -->
<div class="container">
<!-- Dashboard title and description -->
<div class="header">
<h1>🌱 Soil Sensor Dashboard</h1>
<p>Monitoring soil conditions with Raspberry Pi Zero W</p>
</div>
<!-- Section displaying the most recent readings -->
<div class="current-readings">
<div class="reading-card">
<div class="reading-label">Temperature</div>
<!-- Placeholder for temperature reading -->
<div class="reading-value temperature" id="temperature">
<span class="loading">Loading...</span>
</div>
<div class="reading-unit">°C</div>
</div>
<div class="reading-card">
<div class="reading-label">Soil Moisture</div>
<!-- Placeholder for moisture reading -->
<div class="reading-value moisture" id="moisture">
<span class="loading">Loading...</span>
</div>
<div class="reading-unit">Level</div>
</div>
</div>
<!-- Historical chart area -->
<div class="charts-section">
<h2>Historical Data</h2>
<div class="chart-controls">
<!-- Buttons to switch chart time ranges -->
<button class="chart-button active" onclick="loadChart(24)">24 Hours</button>
<button class="chart-button" onclick="loadChart(168)">7 Days</button>
<button class="chart-button" onclick="loadChart(720)">30 Days</button>
</div>
<div class="chart-container">
<canvas id="sensorChart"></canvas>
</div>
</div>
<!-- Status and last updated timestamp -->
<div class="status-bar">
<div class="status-indicator">
<div class="status-dot" id="statusDot"></div>
<span id="statusText">Checking connection...</span>
</div>
<div class="last-updated" id="lastUpdated">
Last updated: Loading...
</div>
</div>
</div>
<script>
let chart = null;
let currentPeriod = 24;
// Initialize the dashboard when the page is loaded
document.addEventListener('DOMContentLoaded', function() {
loadCurrentReadings(); // Get latest sensor values
loadChart(24); // Load 24-hour history chart
// Auto-refresh every 5 minutes
setInterval(function() {
loadCurrentReadings();
loadChart(currentPeriod);
}, 300000);
});
// Fetch and display current sensor readings
async function loadCurrentReadings() {
try {
const response = await fetch('/cgi-bin/api.py?action=latest');
const data = await response.json();
if (data.error) {
throw new Error(data.error);
}
// Populate temperature and moisture values
document.getElementById('temperature').innerHTML = data.temperature || 'N/A';
const moistureValue = data.moisture || 0;
document.getElementById('moisture').innerHTML = moistureValue;
// Update connection status
updateStatus(true, data.timestamp);
} catch (error) {
console.error('Error loading current readings:', error);
document.getElementById('temperature').innerHTML = 'Error';
document.getElementById('moisture').innerHTML = 'Error';
updateStatus(false);
}
}
// Load historical data based on time window
async function loadChart(hours) {
currentPeriod = hours;
// Highlight the active button
document.querySelectorAll('.chart-button').forEach(btn => {
btn.classList.remove('active');
});
event.target.classList.add('active');
try {
const response = await fetch(`/cgi-bin/api.py?action=history&period=${hours}`);
const data = await response.json();
if (data.error) {
throw new Error(data.error);
}
// Update the chart with new data
updateChart(data, hours);
} catch (error) {
console.error('Error loading chart data:', error);
// Optionally display error in UI
}
}
// Render the Chart.js graph
function updateChart(data, hours) {
const ctx = document.getElementById('sensorChart').getContext('2d');
// Format timestamps based on time window
const labels = data.map(item => {
const date = new Date(item.timestamp);
if (hours <= 24) {
return date.toLocaleTimeString([], {hour: '2-digit', minute:'2-digit'});
} else if (hours <= 168) {
return date.toLocaleDateString([], {month: 'short', day: 'numeric'}) + ' ' +
date.toLocaleTimeString([], {hour: '2-digit', minute:'2-digit'});
} else {
return date.toLocaleDateString([], {month: 'short', day: 'numeric'});
}
});
// Extract temperature and moisture values for graph
const temperatureData = data.map(item => item.temperature);
const moistureData = data.map(item => item.moisture);
// Remove previous chart instance before drawing new one
if (chart) {
chart.destroy();
}
// Create new line chart
chart = new Chart(ctx, {
type: 'line',
data: {
labels: labels,
datasets: [{
label: 'Temperature (°C)',
data: temperatureData,
borderColor: '#ff6b6b',
backgroundColor: 'rgba(255, 107, 107, 0.1)',
yAxisID: 'y',
tension: 0.1
}, {
label: 'Soil Moisture',
data: moistureData,
borderColor: '#4ecdc4',
backgroundColor: 'rgba(78, 205, 196, 0.1)',
yAxisID: 'y1',
tension: 0.1
}]
},
options: {
responsive: true,
maintainAspectRatio: false,
interaction: {
mode: 'index',
intersect: false,
},
scales: {
x: {
display: true,
title: { display: true, text: 'Time' }
},
y: {
type: 'linear',
display: true,
position: 'left',
title: { display: true, text: 'Temperature (°C)' }
},
y1: {
type: 'linear',
display: true,
position: 'right',
title: { display: true, text: 'Soil Moisture Level' },
grid: { drawOnChartArea: false }
}
},
plugins: {
tooltip: {
callbacks: {
// Append Fahrenheit to tooltip for temp
afterLabel: function(context) {
if (context.datasetIndex === 0) {
const fahrenheit = (context.parsed.y * 9/5) + 32;
return `${fahrenheit.toFixed(1)}°F`;
}
return '';
}
}
}
}
}
});
}
// Update the sensor's connection status UI
function updateStatus(online, lastUpdate = null) {
const statusDot = document.getElementById('statusDot');
const statusText = document.getElementById('statusText');
const lastUpdatedElement = document.getElementById('lastUpdated');
if (online) {
statusDot.classList.remove('offline');
statusText.textContent = 'Sensor Online';
if (lastUpdate) {
const updateTime = new Date(lastUpdate);
lastUpdatedElement.textContent = `Last updated: ${updateTime.toLocaleString()}`;
}
} else {
statusDot.classList.add('offline');
statusText.textContent = 'Sensor Offline';
lastUpdatedElement.textContent = 'Last updated: Connection error';
}
}
// Return textual description of moisture level based on raw value
function getMoistureDescription(value) {
if (value < 200) return 'Very Dry';
if (value < 400) return 'Dry';
if (value < 600) return 'Moist';
if (value < 800) return 'Wet';
return 'Very Wet';
}
</script>
</body>
</html>
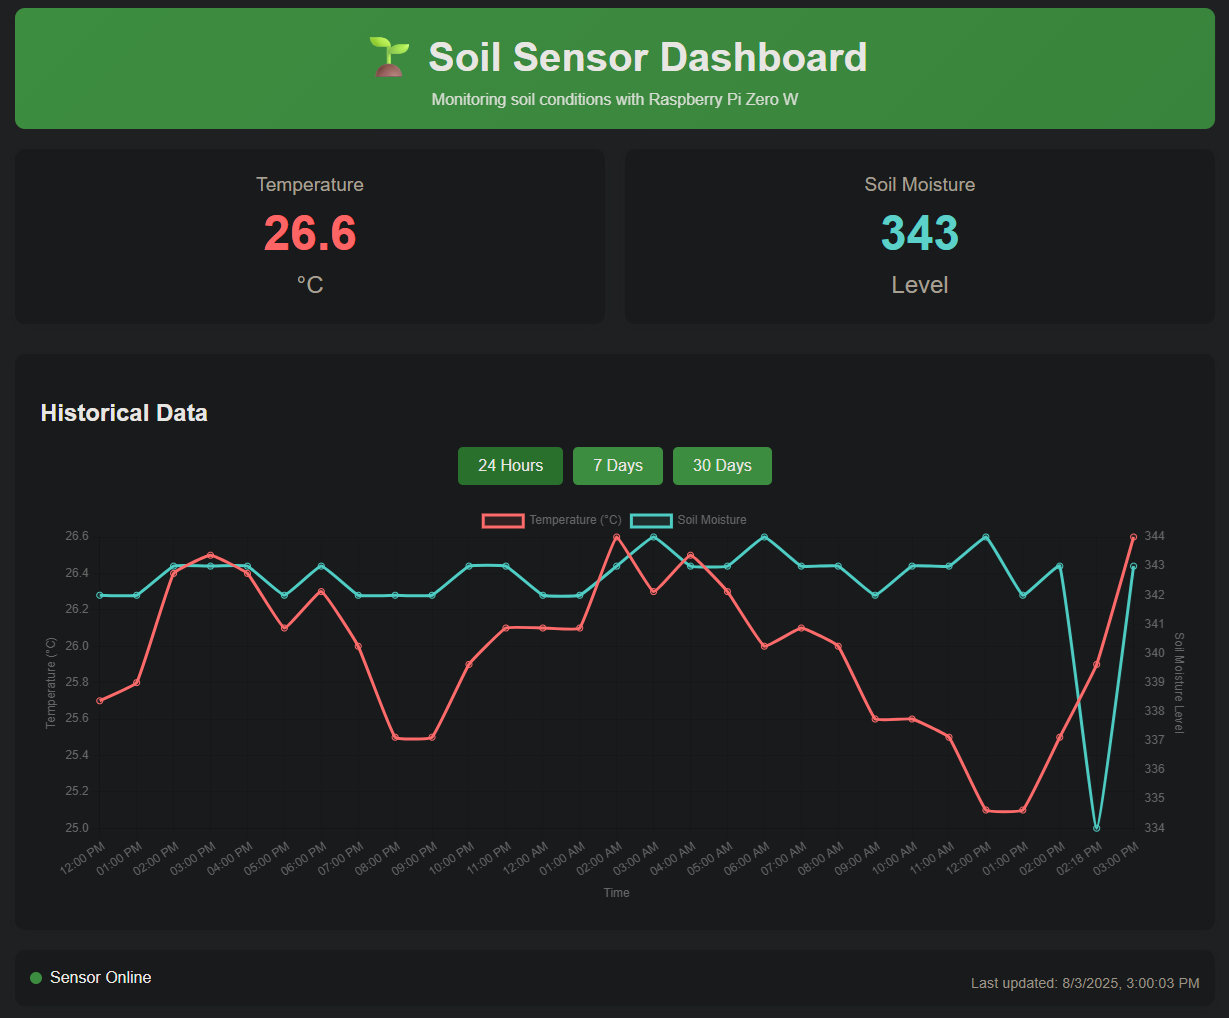
☝ This HTML file creates a responsive, self-contained dashboard for monitoring soil temperature and moisture using a Raspberry Pi Zero W and an I2C sensor. The layout includes a visually styled header, real-time sensor readings, and a historical data chart rendered with Chart.js. Users can toggle between different time ranges (24 hours, 7 days, 30 days) to view past trends, while the dashboard automatically refreshes every five minutes to stay current. Status indicators at the bottom provide live feedback on the sensor’s connectivity and the timestamp of the last update.
💡 The JavaScript embedded in the page handles asynchronous API calls to a Python CGI script (api.py), which serves the latest and historical sensor data from a local SQLite database. Dynamic DOM updates ensure the readings and charts reflect real-time data, while user interactions, like switching chart views, are immediately responsive. The structure is optimized for both desktop and mobile screens, making it a lightweight and efficient frontend for DIY environmental monitoring projects.
Copy and paste the entire index.html content, then:
# Set proper permissions
sudo chown -R www-data:www-data /var/www/html
sudo chmod 644 /var/www/html/index.html
sudo chmod 666 /var/www/html  # Allow database creation
⚡ Part 6: Test Your Installation
Step 14: Take First Sensor Reading
# Test the sensor script
sudo python3 /opt/soil_sensor/sensor_reader.py

# You should see output like:
# INFO:root:Database initialized successfully
# INFO:root:Sensor initialized successfully
# INFO:root:Sensor reading - Temperature: 23.4°C, Moisture: 485
# INFO:root:Data stored successfully - Temp: 23.4°C, Moisture: 485
# Sensor reading completed successfully
Step 15: Test Web Interface
- Find your Pi’s IP address:
ip addr show wlan0 | grep inet - Open web browser and navigate to:
http://[YOUR_PI_IP]/http://raspberrypi.local/
- Test API directly:
curl http://localhost/cgi-bin/api.py?action=latest
You should see your sensor data displayed on the dashboard!
.jpg)
.jpg)
🕐 Part 7: Automate Data Collection
Step 16: Set Up Hourly Data Collection
# Open crontab for editing
sudo crontab -e

# Add this line at the bottom:
0 * * * * /usr/bin/python3 /opt/soil_sensor/sensor_reader.py >> /var/log/soil_sensor_cron.log 2>&1

# Save and exit (Ctrl+X, Y, Enter in nano)
This will take a sensor reading every hour automatically.
Step 17: Enable Log Rotation (Optional)
# Create log rotation config
sudo nano /etc/logrotate.d/soil-sensor

# Add this content:
/var/log/soil_sensor*.log {
    weekly
    rotate 4
    compress
    delaycompress
    missingok
    notifempty
    create 644 root root
}
🎯 Part 8: Final Configuration
Step 18: Restart Apache
sudo systemctl restart apache2
Step 19: Test Everything
# Check sensor logs
tail -f /var/log/soil_sensor.log

# Check cron logs
tail -f /var/log/soil_sensor_cron.log

# Check Apache status
sudo systemctl status apache2
🌐 Part 9: Access Your Dashboard
Your soil sensor dashboard is now available at:
- Local Network:
http://[PI_IP_ADDRESS]/ - Hostname:
http://raspberrypi.local/(if unchanged)
The dashboard will show:
- ✅ Current temperature and moisture readings
- 📊 Historical charts (24 hours, 7 days, 30 days)
- 🔄 Auto-refresh every 5 minutes
- 📱 Mobile-responsive design
🛠️ Troubleshooting
Common Issues:
❌ Sensor not detected (i2cdetect shows no device at 36):
- Check wiring connections
- Ensure I2C is enabled:
sudo raspi-config - Try different jumper wires
❌ Permission errors:
sudo chown -R www-data:www-data /var/www/html
sudo chmod 666 /var/www/html
sudo chmod +x /usr/lib/cgi-bin/api.py
❌ Apache errors:
# Check Apache logs
sudo tail -f /var/log/apache2/error.log

# Restart Apache
sudo systemctl restart apache2
❌ Database issues:
# Check database location and permissions
ls -la /var/www/html/sensor_data.db
sudo chown www-data:www-data /var/www/html/sensor_data.db
❌ Cron job not running:
# Check cron service
sudo systemctl status cron

# Check cron logs
grep CRON /var/log/syslog | tail
📊 Usage Tips
- Take a manual reading:
sudo python3 /opt/soil_sensor/sensor_reader.py - View live logs:
tail -f /var/log/soil_sensor.log - Check database:
sqlite3 /var/www/html/sensor_data.db "SELECT * FROM sensor_readings ORDER BY timestamp DESC LIMIT 5;" - Change reading frequency: Edit crontab with
sudo crontab -e
🎉 You’re Done!
Your Raspberry Pi Zero W is now running a complete soil sensor monitoring system with:
- Automated hourly data collection
- 30-day data retention
- Beautiful web dashboard
- Real-time and historical charts
- Mobile-friendly interface
Enjoy monitoring your plants! 🌱
📚 Want to go deeper?
My Toolbox books turn real Microsoft security telemetry into defensible operations:

🧰 PowerShell Toolbox Hands-On Automation for Auditing and Defense

🛠️ KQL Toolbox: Turning Logs into Decisions in Microsoft Sentinel

📖 Ultimate Microsoft XDR for Full Spectrum Cyber Defense
Real-world detections, Sentinel, Defender XDR, and Entra ID — end to end.
